The American Trucking Association’s seasonally adjusted (SA) For-Hire Truck Tonnage Index fell 1.1% in September after increasing by 0.2% in August. Compared with September 2022, the SA index fell 4.1%, the seventh straight year-over-year (y/y) decrease and the largest over that period.
“After hitting bottom in April, tonnage increased in three of the previous four months, gaining a total of 2.2% before September’s drop,” said ATA Chief Economist Bob Costello. “However, this freight market remains in flux, and the index contracted by 1.1% in September, which erased half of those gains. Additionally, the year-over-year decrease was the largest drop since November 2020 on a tough comparison – September 2022 – which was the previous cycle high. While it is likely a bottom has been hit in truck freight tonnage, there could still be choppy waters ahead as the freight market remains volatile.”
ATA’s For-Hire Truck Tonnage Index is dominated by contract freight instead of spot market freight. It serves as a barometer of the U.S. economy, representing 72.6% of tonnage carried by all modes of domestic freight transportation, including manufactured and retail goods.
Market Watch
All rates cited below exclude fuel surcharges unless otherwise noted.
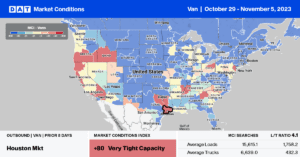
At $2.01/mile last week, outbound dry van linehaul rates in California were $0.02/mile higher than last year when they would still fall for another three weeks, bottoming at $1.95/mile just before Thanksgiving. This year, California average spot rates have been steadily climbing since the middle of September, boosted by the resurgence in import volume on the West Coast. September’s containerized import volumes in the ports of Los Angeles and Long Beach (31% of national volume) were up 13% and 19% y/y.
Average outbound linehaul rates in the top five spot market states (California, Illinois, Georgia, New Jersey, and Texas) increased by $0.02/mile to $1.73/mile last week. That’s almost $0.10/mile higher than in 2019. In Elizabeth, NJ, spot rates were flat at $1.40/mile and $0.27/mile lower than last year, impacted by falling containerized import volumes, down 15% y/y in September.
Load-to-Truck Ratio (LTR)
Three weeks from Thanksgiving and right on cue, dry van spot market load posts (LP) volume increased as shippers moved inventory into crucial consumer markets. Volumes increased 8% week-over-week (w/w), and while that’s good news, it’s about half the increase we’d typically expect based on prior years. Carrier equipment posts dropped 10% w/w, resulting in last week’s dry van load-to-truck ratio (LTR) increasing by 20% to 2.37.

Linehaul Spot Rates
Dry van linehaul spot rates ended in October, where they started at a national average of $1.57/mile, following last week’s $0.01/mile gain. Compared to the previous year, linehaul rates are $0.17/mile lower and remained $0.03/mile higher than 2019. Compared to DAT’s Top 50 lanes based on the volume of loads moved, which averaged $1.88/mile last week, the national average is around $0.31/mile lower.


