As we look to demand signals through the second half of this year and into 2024, manufacturing changes will be vital to estimating truckload demand. One such demand indicator is the Cutting Tool Market Report prepared by the U.S. Cutting Tool Institute (USCTI) and the Association For Manufacturing Technology (AMT). The report provides a monthly statement on U.S. manufacturers’ consumption of the primary consumable in manufacturing – the cutting tool. According to the USCTI, analysis of cutting tool consumption is a leading indicator of upturns and downturns in U.S. manufacturing activity, as it accurately measures actual production levels.
The latest report from May indicates cutting tool consumption totaled $210.6 million, up 10.8% month-over-month (m/m) and up 20% compared with the $175.5 million reported for May 2022. The totals here represent the majority of the U.S. market for cutting tools.
Tom Haag, president at Kyocera SGS Precision Tool, spoke on the cutting tool industry’s May growth, saying, “The cutting tool industry remains inconsistent after 2023 started strong, but demand seemed to decline each month through April. Now May is showing some resilience. The common buzzword for the cause of this variation is ‘supply chain.’ Looking to the summer, July and August generally trend down due to automotive model changes and summer holidays. However, 2022 trended upward, so we hope to see a repeat performance despite economic headwinds.”
Market Watch
All rates cited below exclude fuel surcharges unless otherwise noted.
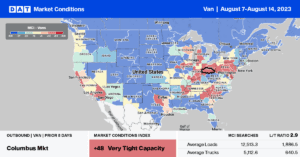
Boosted by sweltering weather in the Southwest, outbound capacity was very tight in the Flagstaff market following last week’s $0.32/mile increase to $1.97/mile. Regional loads to Albuquerque paid carriers $3.10/mile, which is $0.12/mile higher than in 2022.
At $1.94/mile, West Virginia outbound spot rates are identical to 2019 following last week’s $0.08/mile increase. In the larger Charleston market, rates increased by $0.23/mile to an average of $1.87/mile after decreasing for the prior three weeks. Loads from Huntington paid carriers $2.00/mile, the highest since February but only $0.08/mile higher than in 2022.
Outbound capacity tightened slightly in Indianapolis, where rates increased by $0.01/mile to $1.82/mile. State-level rates in Indiana at $1.93/mile are only around $0.06/mile higher than in 2019, while neighboring Ohio rates followed a similar pattern averaging $1.90/mile for outbound loads.
On the West Coast in Los Angeles and Ontario, spot rates dropped for the fourth week to an average of $1.79/mile and $1.88/mile, respectively. California state-level rates are only around $0.08/mile higher than in 2019.
Load-to-Truck Ratio (LTR)
Even though dry van spot market load posts will likely follow a relatively flat seasonal pattern from now until the start of October, volumes are 2% below the Week 32 pre-pandemic average and 11% higher than in 2019. Carrier equipment posts decreased by 3% week-over-week (w/w) as long-haul carriers continued to exit the industry, resulting in last week’s dry van load-to-truck ratio (LTR) dropping 8% – from 2.94 to 2.70.
Linehaul Spot Rates
After being primarily flat in May and June, dry van linehaul spot rates have dropped $0.12/mile since the July 4 break following last week’s $0.03/mile decrease. At $1.59/mile, the dry van linehaul national average rates are just $0.04/mile higher than in 2019. Compared to DAT’s Top 50 lanes (which averaged $1.91/mile last week), the national average was $0.32/mile lower.


