Diesel price hikes in the last few weeks are beginning to impact the industry. DAT Freight & Analytics’ pessimistic modeling scenario was for this year to shape up just as it did in 2019, while on the optimistic side, forecasts called for an uptick in freight activity in the fall, coinciding with peak shipping ahead of the retail shopping season. Current thinking on the latter is becoming less optimistic as retailers and wholesalers continue to draw down bloated 2022 inventories to avoid over-ordering this season.
It’s certainly not time to hit the panic button, but we must watch closely as this quarter may be one of the toughest yet. For carriers, the 11.0% spike (or $0.47/gal) in fuel prices to a national average of $4.24/gal could not have come at a worse time. Following a better June, when operating margins improved to $0.09/mile, the decrease in spot rates and surge in diesel prices in the last month added another $0.05/mile to long-haul operating costs ($1.80/mile), reducing August’s average gross profit margins to just zero cents per mile, down from $0.02/mile in July. That’s the same as in July 2019, when the industry went through record-high bankruptcies.
Carriers were still leaving the industry – albeit at a decreasing rate – until diesel prices raced past $4.00/gal. To make things worse, spot rates are still wallowing around $2.08/mile, including fuel, putting additional pressure on margins.
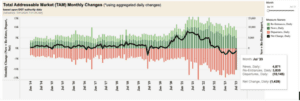
According to data from the FMCSA, the fewest interstate carriers left the industry in July since April 2022, and 27.4% fewer than the peak in January this year. Coincidentally, the number of carriers that left the trucking industry (red bars in Figure 1) last month is almost identical to June 2019. Fewer carriers are also getting back into or joining the trucking industry (green bars), which is currently the lowest since February 2021. Just as the Russian invasion of Ukraine and the resulting spike in diesel prices forced carriers from the industry last April, the concern is the recent similar spike in fuel prices could do the same in the coming months.
Figure 1: Monthly change in interstate carrier authorizations.
Market Watch
All rates cited below exclude fuel surcharges unless otherwise noted.
After loosening for the prior three weeks, dry van available capacity tightened in Chicago following last week’s $0.05/mile increase. At $1.98/mile, the outbound average is $0.05/mile lower than the state average of $2.03/mile, which is identical to 2017 and $0.12/mile higher than in 2019. In nearby Joliet, linehaul rates followed a similar trend, increasing by $0.05/mile to $2.00/mile for outbound loads. On the benchmark lane from Chicago to Atlanta, spot rates have been rising since May, and at $1.87/mile, they have increased by just over $0.20/mile in two months – but remain $0.17/mile lower than in 2022.
In other top five markets, linehaul rates in Elizabeth, NJ, continue to increase, but at $1.44/mile, have increased by just $0.03/mile in the last month. Linehaul rates in Atlanta continue to slide following the previous week’s $0.02/mile decrease to $1.65/mile, while in Dallas, outbound rates were flat at $1.52/mile after dropping for the prior three weeks. On the West Coast in Los Angeles and Ontario, rates fell for the fourth week to $1.87/mile and $1.96/mile, respectively. At $2.07/mile, California state average linehaul rates have dropped $0.10/mile since the year’s high of $2.17/mile a month ago and only sit around $0.14/mile higher than in 2019.
Load-to-Truck Ratio (LTR)
Load post volumes uncharacteristically increased in the first shipping week of the month following the previous week’s 3% gain. For context, volumes are down by 36% year-over-year (y/y) but are still 20% higher than in 2019. Carrier equipment posts dropped for the third week, resulting in last week’s dry van load-to-truck ratio (LTR) improving by 8% – from 2.78 to 3.01, only the third time the dry van LTR has been above 3.0 this year.
Linehaul Spot Rates
Dry van available capacity continued to loosen for the second week, even though spot market volumes have been increasing. Spot rates decreased by just over a penny per mile last week to a national average of $1.63/mile. The national average is $0.33/mile lower than in 2022, and are now just $0.08/mile higher than in 2019 – the gap is closing. Compared to DAT’s Top 50 lanes (which averaged $1.97/mile last week), the national average was $0.34/mile lower.


