As the hope of freight market recovery in 2023 fades, even the forecast scenario for improvement in Q2 2024 is in doubt, according to Prof. Jason Miller of Michigan State University, in releasing the latest Trucking Ton-Mile Index (TTMI). The index is calculated as a weighted geometric mean of physical output, inflation-adjusted sales, or total labor hours for 41 freight-generating sectors of the economy as identified by the Census Bureau and Bureau of Transportation Statistics in the Commodity Flow Survey. For truckload carriers, the TTMI has proven to be the most reliable indicator of freight demand, which points towards a prolonged period of weak truck transportation demand.
The August TTMI was 0.3% higher than in July, 2.0% lower than August 2022, and 3.2% lower than the March 2022 high water market for freight demand. Miller said, “We are a long way off from the increase in freight volumes that we will need to get ourselves out of this current freight recession. We will exit the freight recession in a much slower, more progressive manner than the past two cycles (which saw the balance of supply and demand turn in just a few months). Assuming the Federal Open Market Committee (FOMC) keeps interest rates elevated for longer, we may be looking at a soft demand environment for at least nine more months (it looks increasingly unlikely that the Q2 2024 recovery in freight volumes.”
Market Watch
All rates cited below exclude fuel surcharges unless otherwise noted.
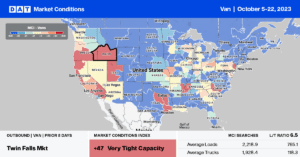
Available dry van capacity tightened in the Pacific Northwest (PNW) and Mountain Prairie regions last week following last week’s $0.03/mile increase to $1.59/mile. Dry van rates in this part of the country have increased by $0.24/mile since the start of September and are expected to increase by another $0.30/mile shortly before Xmas, driven by Fall produce and Xmas tree shipping peaks. Solid gains were reported in the Twin Falls, ID, market, where spot rates increased by $0.11/mile to $1.61/mile on 15% higher week-over-week (w/w) higher load posts.
In Los Angeles and Ontario markets, spot rates increased by $0.02/mile to $1.84/mile, boosting the state average to $1.98/mile for outbound loads. Spot rates dropped for the fourth week in Atlanta following last week’s $0.04/mile decline to an average of $1.45/mile, with Chicago and Joliet markets following a similar month-long slide to $1.99/mile. In Elizabeth, NJ, spot rates dropped for the third week to $1.40/mile, down $0.02/mile last week, with loads to Atlanta paying carriers $1.38/mile, almost $0.10/mile lower than the prior month.
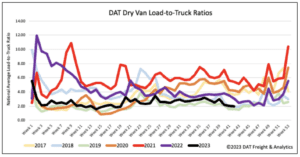
Load-to-Truck Ratio (LTR)
Dry van spot market load posts (LP) were flat for the second week but remained 48% lower year-over-year (y/y). Carrier equipment posts were also flat, resulting in last week’s dry van load-to-truck ratio (LTR) mainly remaining flat at 2.00.
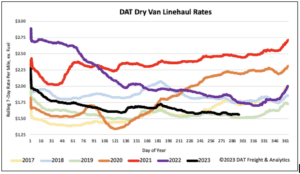
Linehaul Spot Rates
Dry van linehaul spot rates have been mostly flat for the last three weeks following last week’s slight increase by less than a penny per mile. At $1.57/mile, last week’s national average was $0.19/mile lower than last year and $0.05/mile higher than 2019. Compared to DAT’s Top 50 lanes based on the volume of loads moved, which averaged the same as the prior week at $1.88/mile last week, the national average is around $0.31/mile lower.