U.S. single-family homebuilding increased for a second straight month in March, following a 3.36% sequential gain. According to the U.S. Census Bureau, building permits, a leading indicator of future flatbed demand, increased by 4% m/m, offering some glimmers of hope for the depressed housing market ahead of the busy spring selling season. The industry started almost 400,000 fewer single-family homes in March compared to a year ago (equivalent to approx. 80,000 fewer flatbed loads excluding appliances).
Compared to March 2019, the number of homes started was just 21,000 more last month, reinforcing our view that the 2023 flattened market looks like 2019 did. Single-family homebuilding increased by 4.4% in the Northeast and jumped 23.6% in the Midwest. In the Southeast, where 63% of new single-family homes were started in March, volumes increased by 4.8%, while volumes plunged by 16.0% in the West.
The American Trucking Association’s advanced seasonally adjusted (SA) For-Hire Truck Tonnage Index fell 5.4% in March after increasing by 0.9% in February. Compared with March 2022, the SA index decreased by 5%, which was the first year-over-year decrease since August 2021. ATA Chief Economist Bob Costello said, “After increasing a total of 2.6% during the three previous months, March’s sequential decline was the largest monthly drop since April 2020 during the start of the pandemic. Falling home construction, decreasing factory output, and soft retail sales all hurt contract freight tonnage – which dominates ATA’s tonnage index – during the month. Despite the largest year-over-year drop since October 2020, contract freight remains more robust than the spot market, which continues to see prolonged weakness.”
Market Watch
All rates cited below exclude fuel surcharges unless otherwise noted.
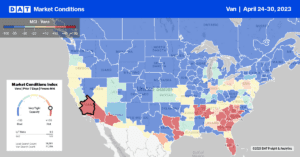
Dry van capacity continues to tighten in the Southeast, where produce season impacts overall available capacity levels. At $1.61/mile, regional rates were up $0.05/mile last week and around the same levels as in 2017 and 2019. Solid gains were reported in Jacksonville, where spot rates jumped by $0.11/mile to an average outbound rate of $1.53/mile on an 8% higher volume. At $1.20/mile, loads 870 miles west to Houston were $0.10/mile higher than the March, while regional loads south to Miami were at the lowest in 12 months at $2.17/mile. Spot rates in Atlanta increased for the third week to $1.64/mile – Georgia state-level rates are $0.10/mile higher at $1.74/mile and identical to 2019.
In California, spot rates increased by $0.03/mile for outbound loads, just $0.07/mile higher than in 2019. In Stockton, volumes were up 7% w/w, pushing up spot rates by $0.06/mile to $1.53/mile, while in Los Angeles, the most significant spot market in the state, volumes were up 11% w/w and rates up $0.02/mile to $1.58/mile. In Chicago, spot rates dropped for the fourth week to $1.85/mile even though volumes were up 8% w/w. Chicago to Atlanta loads at $1.77/mile was the lowest in 12 months, $0.24/mile lower than the March average and almost $1.50/mile than the previous year.
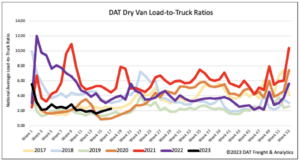
Load-to-Truck Ratio (LTR)
End-of-month shipping activity provided a much-need boost following last week’s 12% w/w increase in spot market load posts. Compared to the end of the first quarter, last week’s volumes were 9% higher. Equipment posts increased by 4% w/w, resulting in the dry van load-to-truck ratio (LTR) increasing for the third week from 2.04 to 2.21.
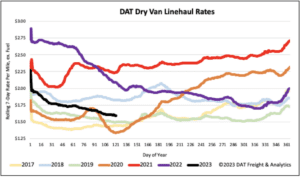
Linehaul Spot Rates
The multi-week slide in dry van linehaul rates was halted last week. Spot rates were flat compared to the prior week, and while this could be the bottom in spot rates we’ve been waiting for, it could also be temporary following the end-of-month shipping surge. At $1.62/mile, excluding fuel, the national average dry van rate is now $0.10/mile above 2019 levels. Based on the volume of loads moved the average rate for the top 50 dry van lanes was $0.23/mile higher at $1.84/mile last week.