Despite forecasts of a muted peak season for imports, August container import volumes were surprisingly higher than July. This was surprising because of recent reports of excess inventories that still need to be whittled down. However, TEU (twenty-foot equivalent units) volumes were only up 0.6% month-over-month (m/m) and remained down by 14% year-over-year (y/y). To put last month’s volume into perspective, total TEU volume is tracking closest with 2018 and 2019 levels for this time of the year. The Port of Los Angeles held the number one import spot; volumes were up 18.1% m/m and 9.1% y/y. In contrast, the Port of New York/New Jersey, the number two port, reported 3.9% lower volumes in August than in July and almost 18% lower than in August 2022.
Overall, East Coast volumes were down 4% m/m and 17% y/y; West Coast volumes were down 6% m/m and 10% y/y, while the Gulf Coast reported 2% higher volume compared to July while being down 5% y/y. Furniture remained the number one commodity imported with 12% of TEU volume, followed by plastic products (5%) and auto parts (3%). Menswear import volumes continue to climb, up 230% y/y, spread evenly between Los Angeles, Long Beach, and New York, each reporting 20-22% of volume.
On the Gulf Coast, semiconductor imports are still surging this year. Volumes are up 3% m/m and 525% y/y. Auto parts in the Gulf also recorded their highest volume in the past five years, with TEU volume up 6% m/m and 16% y/y. The largest Gulf Coast port for auto parts volume is the Port of Mobile, Alabama; Port Houston is second. Over 96% of the Gulf Coast auto parts volume goes through these two ports.
Market Watch
All rates cited below exclude fuel surcharges unless otherwise noted.
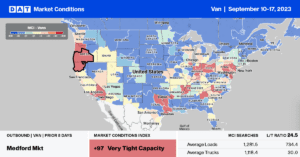
After dropping for the prior three weeks, outbound linehaul rates in Los Angeles were flat last week at $1.71/mile, boosted by higher import volumes in August. On key West Coast lanes to warehouse markets, including Stockton and Phoenix, the volume of loads moving is up 7% m/m and 1% m/m, respectively. Los Angeles to Stockton loads paid carriers $2.39/mile last week, the lowest in 12 months, while Phoenix loads at $2.81/mile were at the 3-month average but $0.53/mile lower in 2022. Outbound California spot rates have been decreasing steadily since the July 4 break and, at $1.93/mile, are identical to 2019.
A shortage of trucks was reported in Seattle last week following August’s 14% increase in import volume; spot rates increased by $0.06/mile to $1.15/mile, while at $1.33/mile, Washington state rates are identical to 2019. Seattle to Los Angeles loads were paying carriers $0.53/mile, the lowest in 12 months, while loads in the opposite direction averaged $2.16/mile, making a round-trip average of just $1.36/mile.
In Chicago and Joliet, spot rates increased for the fourth week to $2.08/mile, and at $2.12/mile, Illinois state-level rates are around $0.05/mile higher than in 2019. At $1.49/mile for outbound loads, Elizabeth, NJ, linehaul rates are the highest in a month, and after increasing over the prior three weeks to $1.59/mile, outbound Atlanta linehaul rates dropped $0.04/mile to $1.55/mile last week.
Load-to-Truck Ratio (LTR)
Dry van spot market load posts (LP) regained the losses from the prior short workweek to be around the average for the last six weeks. Load posts increased 6% w/w but are still 24% lower than last year and just 4% above 2019 levels. Carrier equipment posts increased by 16% w/w, resulting in last week’s dry van load-to-truck ratio (LTR) decreasing from 3.31 to 2.95.
Linehaul Spot Rates
At just over $1.60/mile, dry van linehaul spot rates have been around this level for the past six weeks, showing more definite signs of bottoming out. Last week’s national average was $0.25/mile lower than in 2022 and only $0.02/mile higher than in 2019. Compared to DAT’s Top 50 lanes based on the volume of loads moved, which averaged $1.91/mile last week, the national average is around $0.30/mile lower.


