Since the Electronic Logging Devices (ELD) Mandate went into effect in December 2017, just under 1,000 devices from a variety of manufacturers have been registered with the U.S. Department of Transportation’s Federal Motor Carrier Safety Administration (FMCSA) to act as logging devices for the hours of service regulation. Of the 994 registered, an amazing 159 have failed to meet the FMCSA standard and were subsequently revoked. The last three were removed from the approved list in late July, giving carriers using them just 60 days to replace the revoked ELDs.
FMCSA has placed these ELDs on its Revoked Devices list due to the companies’ failure to meet the minimum requirements established in 49 CFR part 395, subpart B, appendix A, effective July 25, 2023. According to FMCSA, the devices were revoked because they failed to meet the minimum requirements established, which “requires that an ELD without a printer be designed so that an authorized safety official may reasonably view the display without entering the commercial motor vehicle.”
What happens next?
As noted, motor carriers using these devices have up to 60 days to replace the revoked ELDs with compliant ELDs. If the ELD providers correct all identified deficiencies, FMCSA will place the ELDs back on the list of registered devices and inform the industry and the field. FMCSA will send an industry email to let motor carriers know that all who use these revoked ELDs must take the following steps:
- Discontinue using the revoked ELDs and revert to paper logs or logging software to record required hours of service data.
- Replace the revoked ELDs with compliant ELDs from the Registered Devices list before September 23, 2023.
During this time, safety officials are encouraged not to cite drivers using these revoked ELDs for 395.8(a)(1) – “No record of duty status” or 395.22(a) – “Failing to use a registered ELD.” Safety officials should request the driver’s paper logs and logging software or use the ELD display as a backup method to review the hours of service data.
Beginning September 23, 2023, motor carriers that continue to use the revoked devices listed above will be considered operating without an ELD, and the driver will be placed out-of-service (OOS) per the Commercial Vehicle Safety Alliance OOS Criteria.
Market Watch
All rates cited below exclude fuel surcharges unless otherwise noted.
Hurricane Idalia, the first significant storm to make U.S. landfall this season, had less impact on freight markets than expected. Carriers were kept from the Southeast Region, with capacity tightening briefly as the fast-moving storm raced across northern Florida, southern Georgia, and the Carolinas. Dry van rates in the region increased by $0.01/mile to $1.57/mile for outbound loads after decreasing for three weeks. Inbound regional rates increased by $0.07/mile to $1.87/mile in comparison.
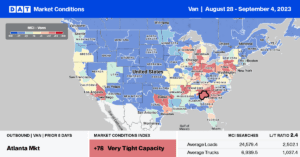
After dropping for the last three weeks, outbound spot rates in Atlanta increased by $0.01/mile to $1.56/mile as this massive regional distribution market shifted volume into the storm-affected region. Loads moving from Atlanta to Lakeland, FL, paid carriers $2.71/mile, just over $0.20/mile higher than the August average.
In the Midwest markets of Chicago and Joliet, linehaul rates increased for the third week following last week’s $0.06/mile increase to $2.04/mile. The same trend was reported in Elizabeth, NJ, where spot rates increased by $0.02/mile to $1.44/mile, while rates on the Atlanta lane were slightly higher, averaging $1.46/mile, up $0.08/mile compared to the August average. On the West Coast, linehaul average rates at $1.97/mile are just $0.07/mile higher than in 2019 in California. Los Angeles outbound spot rates continue to tumble following last week’s $0.03/mile decrease to $1.74/mile, while next door in Ontario, rates dropped for the fourth week to an average of $1.82/mile.
Load-to-Truck Ratio (LTR)
Dry van spot market load posts were boosted last week by Labor Day demand and end-of-month shipping. Volumes increased 2% week-over-week (w/w), although that volume was around 30% lower than last year. Carrier equipment posts decreased by 7% w/w, resulting in last week’s dry van load-to-truck ratio (LTR) increasing by 6% w/w from 2.85 to 3.02.
Linehaul Spot Rates
Spot market capacity tightened last week as carrier exits accelerated in August following the recent surge in diesel prices. Dry van spot rates followed a seasonal pattern before Labor Day, increasing by $0.03/mile, bringing the national average to $1.62/mile last week. The national average last week was $0.27/mile lower than the same week in 2022 and identical to 2019. Compared to DAT’s Top 50 lanes (which remained at $1.90/mile last week), the national average was $0.28/mile lower.


