The two-week strike by the International Longshore and Warehouse Union (ILWU) workers in British Columbia was initially over and is now back on. The strike is causing supply chain disruptions because import containers are delayed or diverted to other ports. According to third-party logistics provider ITS Logistics, the labor strike at the ports of Vancouver and Prince Rupert will not only negatively impact Canada but will also have a negative impact on the U.S. supply chain due to reconsigned freight. During the strike, ITS advised customers to put contingency plans in place to reroute cargo into the U.S. and alter the mode of transportation to domestic truckload.
“Most of the inland point intermodal freight that enters through these ports is destined for major U.S. rail hubs, including Chicago and Memphis,” said Paul Brashier, vice president of Drayage and Intermodal for ITS Logistics. “There is a high probability that a large portion of this freight will be reconsigned to U.S. West Coast ports if the vessels call on those ports before or after calling Vancouver or Prince Rupert.”
The Railway Association of Canada estimates one strike day equals three to five days of clearing up. This strike means the rail congestion alone could be between 39 and 65 days. In the short term, this could translate into more spot market volumes for truckload carriers and brokers as shippers seek to move delayed import freight.
Market Watch
All rates cited below exclude fuel surcharges unless otherwise noted.
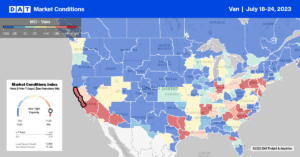
At $1.32/mile, outbound Washington state spot rates were up slightly last week but are just $0.05/mile higher than in 2019. In the Seattle market, there was no material evidence that the port workers’ strike and the import container diversion had increased spot market activity. Available capacity in Seattle loosened last week following a $0.04/mile decrease to $1.12/mile. Seattle to Los Angeles loads paid carriers just $0.54/mile, the lowest in 12 months.
Outbound capacity was tighter in the San Francisco and Stockton markets last week. In San Francisco, spot rates increased $0.03/mile to $1.88/mile, while in nearby Stockton, rates increased $0.02/mile to $1.82/mile. At $1.83/mile, outbound rates in Flagstaff were $0.02/mile higher last week after steadily increasing for the prior month.
Outbound Pennsylvania linehaul rates were flat last week at $1.65/mile, just $0.04/mile higher than in 2019. In the Allentown market, spot rates increased $0.02/mile to $1.54/mile last week, while next door in Harrisburg, linehaul rates decreased $0.01/mile to $1.56/mile.
In other Top 5 markets, capacity was primarily flat in Elizabeth, NJ, at $1.42/mile for outbound loads, while in Atlanta, capacity eased following last week’s $0.09/mile drop to $1.72/mile. Chicago and Dallas followed a similar trend – rates dropped $0.05/mile to $1.95/mile and $1.55/mile, respectively. In the combined Los Angeles and Ontario markets, rates dropped $0.02/mile to $1.93/mile.
Load-to-Truck Ratio (LTR)
Except for 2019, spot market load posts were at the lowest in seven years for Week 29 following last week’s 8% week-over-week (w/w) decline. Volumes are tracking at around half what they were at 2022’s midpoint in what’s known as the “dog days of summer,” which officially refers to the period between July 3 to August 11 each year. Load posts are around 17% lower than we’d typically expect to see at this time of the year, and coupled with slightly higher equipment posts, last week’s dry van load-to-truck ratio (LTR) decreased by 4% – from 2.60 to 2.49.
Linehaul Spot Rates
The dry van linehaul market continues to loosen following last week’s $0.03/mile decrease. At $1.66/mile, the national average is $0.29/mile lower than in 2022 and only $0.10/mile higher than in 2019. Linehaul rates typically cool off post-July 4, and so far, they’ve dropped $0.07/mile since Independence Day; in 2016, 2017, and 2019, they decreased by $0.09/mile. Compared to DAT’s Top 50 lanes (which averaged $2.00/mile last week), the national average was $0.34/mile lower.


