The latest data from IHS Markit for the month of October shows imports overall are up by just under one percent y/y, while the split between various coasts tells a very different story. For at least the last six months, we’ve seen a noticeable shift of import volumes away from the West Coast, where labor negotiations are into their fifth month, and to the Gulf and East Coast. West Coast import volumes were down 19% y/y in October compared to an increase of 5% y/y for East Coast ports and 19% for Gulf Coast ports. We’ve also seen a decline in imports from Mainland China, where import volumes have decreased by 17% y/y. Compared to the Southern Asia ports of Vietnam and the Republic of Korea, import volumes are up 49% and 15% y/y, respectively.
The East and Gulf Coasts have been preferred destinations for importers looking to avoid the possibility of port strikes or slowdowns and vessel congestion levels on the West Coast. According to Michigan State University Associate Professor Jason Miller, “September Asian imports are up 23% from 2021, 33% from 2020, 39% from 2019, and 47% from 2018. You read those numbers correctly; on a metric tonnage basis, containerized imports from Asia entering through the Gulf and East Coast have increased almost 50% from their 2018 levels. This is something worth noting: even with the sharp slowdown, we are still above 2019 levels.” Miller reported total imports from Asia across 20 import districts were up 4% from 2021, 11% from 2020, 23% from 2019, and 21% from 2018 for September.
Market Watch
All rates cited below exclude fuel surcharges unless otherwise noted.
The good news is anyone who wants a Christmas tree this year will be able to find one but shop early if you have a specific tree in mind, according to the American Christmas Tree Association (ACTA). This year, to pre-empt the supply chain disruption that impacted the availability of trees at retailers across the country in 2021, Christmas tree retailers are bringing in products earlier than in previous years. The U.S. imports around 80% of artificial Christmas Trees from China, with imports volumes peaking in October each year. According to IHS Markit PIERS import data, the volume of Christmas-related imports is up 8% y/y and 22% compared to the same time in 2020.
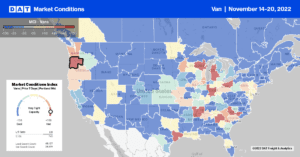
The demand for live Christmas Trees is expected to be strong this year, with typical outbound freight markets in the Pacific Northwest (PNW) and Pacific Maritimes amid peak shipping volumes. In Portland, OR, the largest producer of Christmas Trees, spot market volumes increased by 11% w/w, making it the fourth week of gains. Spot rates in Portland for outbound loads spiked, rising by $0.11/mile to an average of $1.43/mile last week. Loads from Portland to Stockton, CA, increased slightly last week to $1.03/mile, which is close to $0.50/mile lower than the previous year.
Even though PNW outbound regional linehaul rates increased by $0.08/mile last week, they are just $0.05/mile higher than in 2016 and almost $1.00/mile lower than the previous year. In the second largest Christmas Tree producing state in North Carolina, spot rates increased $0.03/mile to an average outbound rate of $1.69/mile. On the West Coast in Los Angeles, spot rates dropped for the fourth week to $1.72/mile, down $0.13/mile in the last four weeks. On the high-volume lane to Stockton, spot rates at $2.44/mile are the lowest in 12 months and $1.56/mile lower y/y. Loads from Los Angeles to Phoenix followed a similar trend and at $2.56/mile are almost $2.00/mile lower than the previous year.
Load-to-Truck Ratio (LTR)
Dry van spot market load posts followed seasonal trends following last week’s 13% w/w increase in the lead-up to Thanksgiving. Volumes remained 44% lower than the previous year and 5% higher over the last month. Dry van capacity tightened the previous week slightly, but the number of carriers posting their equipment in search of loads is now 17% higher than last year, a sign that spot market capacity is oversupplied. Carrier equipment posts remained at a record high last week for the middle of November and 5% more than in the middle of April 2020. As a result, the dry van load-to-truck ratio (LTR) increased slightly from 2.13 to 2.43.
Linehaul Spot Rates
Dry van linehaul spot rates flatlined last week at a national average of $1.71/mile but remained 32% or around $0.80/mile lower than the previous year. Dry van rates have dropped by $1.07/mile since the start of the year and are approximately $0.11/mile lower than in 2017 and 2018. Compared to the oversupplied 2019 truckload market, last week’s spot rate is still $0.15/mile higher, although that gap appears to be closing rapidly. The national average linehaul rate of $1.71/mile is $0.30/mile lower than the top 50 dry van lanes based on the volume of loads moved, which averaged $2.01/mile last week.


