Truckload demand remains strong despite the headline-grabbing talks of a freight recession. All reputable and representative truckload demand indicators point to volumes being up year-over-year, not down. If you have significant exposure to retail freight, volumes are certainly lower than in previous years, but that’s just one segment of the truckload industry. According to the most recent Cass Shipments Index, year-over-year, shipments for October were up 2.9% from 2021, 3.7% from 2020, 6.3% from 2019, and even 2018, the latter being an excellent year for truckload carriers. The ATA Truck Tonnage Index reported freight volume up 5.5% in September and 2.3% y/y in October.
According to Prof. Jason Miller and Yemisi Bolumole at Michigan State University, their trucking ton-mile index (TTMI) for the end of the third quarter showed activity up 0.3% m/m and 4.2% y/y. Miller said, “The robust year-over-year growth was driven by manufacturing output and inflation-adjusted wholesale trade gains. While this may seem surprising, remember both Cass’ Shipments and ATA’s tonnage indexes were also up year-over-year in September (seems unlikely all of us have it wrong).” Even though demand in specific sectors appears to be softening, truckload volumes, as reported by Cass, ATA, and the MSU TTMI, all point to aggregate trucking volumes being above where they were last year. “The reason for prices softening is that we have seen increases in supply that are even larger, which is pulling down prices,” according to Prof. Miller.
Market Watch
All rates cited below exclude fuel surcharges unless otherwise noted.
Last week, a short work week resulted in slightly higher linehaul rates in most freight markets. In Washington and Oregon, spot rates increased for the fourth week to $1.65/mile for all outbound loads following last week’s $0.07/mile gain. Regional rates are slightly above 2016 levels, though. In Seattle, linehaul rates increased by $0.06/mile to $1.38/mile, while on the high-volume lane to Los Angeles, rates increased last week to $0.91/mile or $0.14/mile higher than the October average. While in Los Angeles, after dropping for the three weeks prior, spot rates increased by $0.06/mile last week to $1.75/mile. In neighboring Ontario, linehaul rates increased by the same amount to an average of $1.89/mile. Loads east to Phoenix hit a 12-month low of $2.51/mile or $2.00/mile lower than the previous year.
In Chicago, outbound linehaul rates increased by $0.06/mile to $2.23/mile, while in Atlanta, rates increased by $0.05/mile to $1.63/mile. Further north in Elizabeth, NJ, spot rates increased by $0.04/mile to $1.60/mile last week. Dry van loads west to Chicago dropped to $1.07/mile last week, exactly $1.00/mile lower than the previous year, while loads south to Atlanta were more than $1.00/mile lower at $1.44/mile last week. Outbound linehaul rates in Florida are almost identical to 2019 at $1.20/mile following the previous week’s $0.08/mile increase.
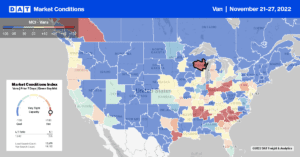
Load-to-Truck Ratio (LTR)
Dry van spot market load posts dropped to 2019 levels last week, the second-lowest weekly volume recorded in the previous six years. Dry van capacity tightened slightly as expected, although the number of carriers posting their equipment in search of loads is now 24% higher than last year, a sign that spot market capacity remains oversupplied as we pass the Thanksgiving peak. Carrier equipment posts were at the highest level in six years resulting in last week’s dry van load-to-truck ratio (LTR) decreasing slightly from 2.43 to 2.13.
Linehaul Spot Rates
Seasonality emerged last week right on queue for dry van linehaul spot rates but at a much more subdued level this Thanksgiving. A short workweek and carriers taking time off over the holiday weekend resulted in linehaul rates increasing to $1.77/mile following last week’s $0.06/mile gain. On the prior two Thanksgivings, dry van linehaul rates averaged $2.39/mile, leaving last week’s national average $0.63/mile lower but $0.08/mile higher than non-pandemic years back to 2016. The national average linehaul rate of $1.77/mile is $0.28/mile lower than the top 50 dry van lanes based on the volume of loads moved, which averaged $2.05/mile last week.


