By Christina Ellington
The latest durable goods manufacturers’ shipments, inventories, and orders report indicate that freight volume hasn’t declined yet. According to the Census Bureau, new orders for manufactured durable goods in May increased by $1.9 billion, or 0.7%, to $267.2 billion. Up seven of the last eight months, this increase followed a 0.4% April increase. Last month’s increase reflected a 1.1% rise in machinery orders.
“There’s some inflation behind the increase in orders, but, nevertheless, there are a lot of dollars flowing through the economy right now,” said Christopher Rupkey, chief economist at FWDBONDS in New York. “Businesses would not order new equipment if they thought consumers and other companies were looking to pull back their purchases.”
In May, shipment of manufactured durable goods increased by $3.6 billion or 1.3%, followed by a 0.3 % April increase. Transportation equipment led the increase by $1.7 billion or 2.1%. Inventories of manufactured durable goods have increased for 16 consecutive months and rose $2.7 billion, or 0.6%, in May following a 0.9% April increase. Machinery led the increase by $1.0 billion or 1.2 %.
“We’ve seen two of the largest inventory builds on record in the past two quarters, but, taken in the context of still solid sales, inventories are not yet at a concerning level in our view,” said Tim Quinlan, a senior economist at Wells Fargo in Charlotte, North Carolina. “We take the rebuild in inventories as a signal that supply chain problems are slowly easing.”

All rates cited below exclude fuel surcharges unless otherwise noted.
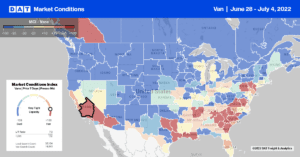
In recent weeks, containerized import volumes have been higher year-over-year out of the Port of Los Angeles, the nation’s largest. According to the port’s weekly volume report, they’re estimating volumes to be around 26% higher y/y in the next two weeks. As it did last year, higher import volumes result in higher truckload spot market volumes on key lanes, including Los Angeles to Chicago – loads moved have been rising for the last month following last week’s 7% w/w increase. At $1.80/mile, spot rates on this lane are still $0.91/mile lower y/y, even though there are signs linehaul rates on this lane are rising slowly. Spot rates in the overall Los Angeles market were up another $0.03/mile last week to an average outbound rate of $2.27/mile.
After falling for the last month, spot rates in Savannah, GA, the number four port in the country, increased by $0.03/mile to $2.27/mile. Jacksonville, FL, followed a similar trend with rates up $0.02/mile to an average of $1.91/mile, while farther north in the number two port in the country, outbound spot rates in Elizabeth, NJ, increased by $0.04/mile to $1.69/mile.
On the Elizabeth to Chicago lane, linehaul rates continue to slide to an average of $1.43/mile or $0.30/mile lower y/y. Loads south to Atlanta remained flat last week at $1.47/mile, while loads from Atlanta to Orlando increased by $0.03/mile to $3.07/mile.
In Texas, spot rates from Dallas to Laredo increased last week by $0.32/mile to $1.29/mile. Outbound rates in Chicago increased by $0.04/mile to $2.15/mile after dropping over the previous four weeks. Still, they continued to fall on the Atlanta lane, where linehaul rates are currently averaging $1.70/mile or almost $1.00/mile lower than the previous year.

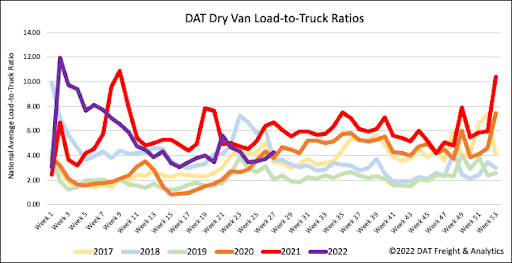
Dry van load posts increased another 5% last week as the end of month, quarter and half-year drew to a close. Volumes remain 7% lower than this time in 2018 and 28% lower than in 2021. Equipment posts in the DAT freight network decreased 8% last week and were at the highest level in the previous six years by the end of June. As a result, last week’s dry van LTR increased slightly to 4.29.

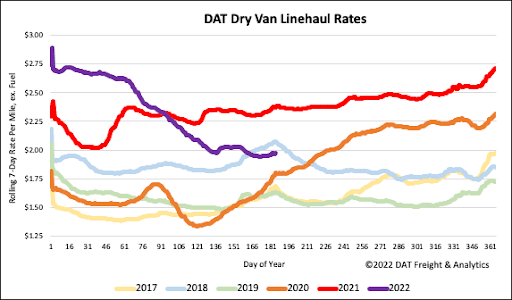
Dry van linehaul spot rates on the top 50 lanes averaged $2.39/mile last week, or $0.40/mile higher than last week’s national average rate of $1.99/mile. Dry van linehaul rates increased by just over $0.02/mile last week and are also $0.40/mile lower compared to the previous year and even $0.10/mile lower than in 2018. Dry van linehaul rates excluding fuel have dropped by over 28% or $0.85/mile YTD but are still $0.25/mile higher than the average of pre-pandemic years.


