Intermodal provides a valuable complement to truckload regarding a shipper’s choice of transport mode for long-haul freight. Intermodal is typically slower than full truckload shipping (transportation takes at least one day longer on most lanes) and is more complex (it involves multiple parties). The benefits are considerable, though. They include cost-savings on high-volume lanes, especially longer-haul lanes such as Los Angeles to Chicago. In a recent Journal of Commerce article, Ari Ashe writes, “shippers believe intermodal providers will have to slash rates on lanes shorter than 1,200 miles to remain competitive with trucks.” On those shorter routes, intermodal spot rates were just 5% lower than truckload rates in the third quarter, compared with a savings of 26% on hauls of more than 2,000 miles, according to the JOC Intermodal Savings Index (ISI).
Intermodal volumes ended 2022 down by 4.8% y/y, according to the American Association of Railroads (AAR), with most experts predicting intermodal with struggle again in 2023 to gain market share in a competitive truck market and a shift in U.S. imports from the West Coast to East and Gulf ports. It’s estimated that as much as 30% of intermodal freight moves on the Los Angeles to Chicago lane, one tightly connected to Asian imports looking to make their way inland via lower-cost railroads. As more freight moves to the East Coast, lower inland volumes can be anticipated as East Coast freight moves on shorter inland lanes.
According to railroad economist Jim Blaze, “the global energy and food crisis should provide plenty of business for the freight railways, as these are bulk products moved in bulk where the economics favor rail over road. There are a few obstacles to progress. The first is less focus on a strict return to cost reduction precision scheduled freight operations, with NS exemplifying the changes underway at some of the Class 1s. The main stumbling block appears to be a continuing shortage of drivers and other train crew. Too many were laid off over the past two years, and too few rehired or recruited from new and then fully trained.” Blaze contends that locomotive shortages should not be a barrier to volume growth as there are plenty of locomotives currently in storage and sufficient manufacturer capacity to build new locomotives if this is the preferred option.
Market Watch
All rates cited below exclude fuel surcharges unless otherwise noted.
A potential major disruption to west coast freight networks appears to have been averted following the 72-hour emergency repair to the bridge that spans the Pecos River near Santa Rosa, New Mexico, last week. According to Ari Ashe at the Journal of Commerce, Union Pacific halted all container movement between Southern California and the Midwest for automotive freight and containers moving between Southern California and the Midwest hubs of Chicago and Kansas City. Truckload volumes remain flat between Los Angeles and Chicago. However, capacity did tighten last week, resulting in spot rates reaching a four-month high of $1.53/mile, which is still half what rates were this time last year at $3.02/mile.
Last week, capacity was very tight in Flagstaff, AZ, following a $0.61/mile increase in outbound spot rates to an average of $2.51/mile. State-level outbound rates are the lowest in Arizona at $1.33/mile in five years. However, on the high-volume short-haul lane north to Las Vegas, spot rates averaged $2.00/mile, which is a four-month high but still $1.17/mile lower y/y. After dropping for the prior three weeks, spot rates northbound out of the Tucson market increased by a penny-per-mile to $1.46/mile last week following a 45% w/w increase in load posts. Higher cross-border import volumes impacted spot rates from Nogales to Ontario, CA, with rates increasing by $0.20/mile m/m to $1.41/mile or around $0.25/mile lower y/y. Rates in the opposite direction from Ontario to Nogales averaged $2.36/mile last, making a round-trip average of close to $1.90/mile for dedicated carriers on this lane.
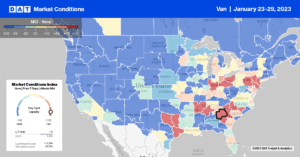
Taking a national look at DAT’s Top 5 states, which include California, Texas, Illinois, Georgia, and New Jersey, average outbound spot rates declined by $0.07/mile last week to $1.91/mile.
Load-to-Truck Ratio (LTR)
The last whole shipping week of January saw spot volumes up 2% w/w after dropping 39% since the start of the year. Compared to week four last year, load posts were 68% lower, while carrier equipment posts were 35% higher over the same timeframe. Removing the pandemic-impacted years of 2021 and 2022, last week’s volumes were 27% higher. As a result of higher load volumes, the dry van load-to-truck ratio (LTR) increased slightly from 2.08 to 2.20, which was over four times lower than the last year.
Linehaul Spot Rates
Following last week’s $0.05/mile decrease to $1.80/mile, the national average dry van rate has dropped 16% since the start of the year, a slightly higher rate of decline than in prior years. Including the last two pandemic-influenced years, dry van spot rates in the previous seven years typically decrease by 11% during the year’s first month. At $1.80/mile, linehaul rates are $0.91/mile lower than the previous year and $0.25/mile lower than the top 50 dry van lanes based on the volume of loads moved, which averaged $2.05/mile last week.


