Market conditions are as strong as ever, with record-high asking rents for warehouse leasing space, according to CBRE’s U.S. Industrial & Logistics Figures Q2 2021 report.
The top five freight markets to watch in terms of highest growth rates for commercial warehouse construction — and by extension dry van volumes — are:
- San Antonio
- Las Vegas
- Phoenix
- Nashville
- Salt Lake City
The main factor driving demand for warehouse space is e-commerce. The Atlanta, Dallas/Ft Worth and Chicago markets are recording the largest under-construction volumes at the end of the second quarter. The CBRE report noted that increased e-commerce demand and the need for safety stock to counter supply chain disruptions will further elevate rent while keeping vacancy rates at record lows.
Find loads and trucks on the largest load board network in North America.
Note: All rates exclude fuel unless otherwise noted.
For dry van and reefer carriers and shippers moving freight in the truckload e-commerce market, more warehouse space in specific locations points to a heavier concentration of inbound loads. But this doesn’t necessarily have a corresponding amount on the outbound side.
Empty running costs to reposition assets into headhaul markets will need to be factored into inbound rates as the commercial warehouse industry undergoes unprecedented levels of growth.
According to a Transwestern mid-year report, markets experiencing the most growth include:
- Savannah
- Lehigh Valley
- Las Vegas
- Inland Empire
- Charleston
- Phoenix
The Transwestern report also looked at the construction pipeline as an indicator of future expansion and concluded Savannah and Austin are growing relatively quickly, with under-construction stock exceeding 12%. Growth in the Sun Belt (Savannah, Austin, Phoenix, San Antonio, Charleston, and Charlotte) have seen the most acceleration of under-construction square footage as a percent of stock over the past year.
As these markets continue to grow and simultaneously struggle to find sufficient labor to staff warehouses and docks, delays loading and unloading, plus higher trailer dwell times will be factors to watch in 2022.
Port congestion continues to dominate the news with the recent oil spill off the coast of Los Angeles, which only adds more delays to vessels waiting at anchor. According to the Port of Los Angeles, average vessel wait time is now 10.1 days (up 1 day since this time last week) for the 62 vessels waiting to unload.
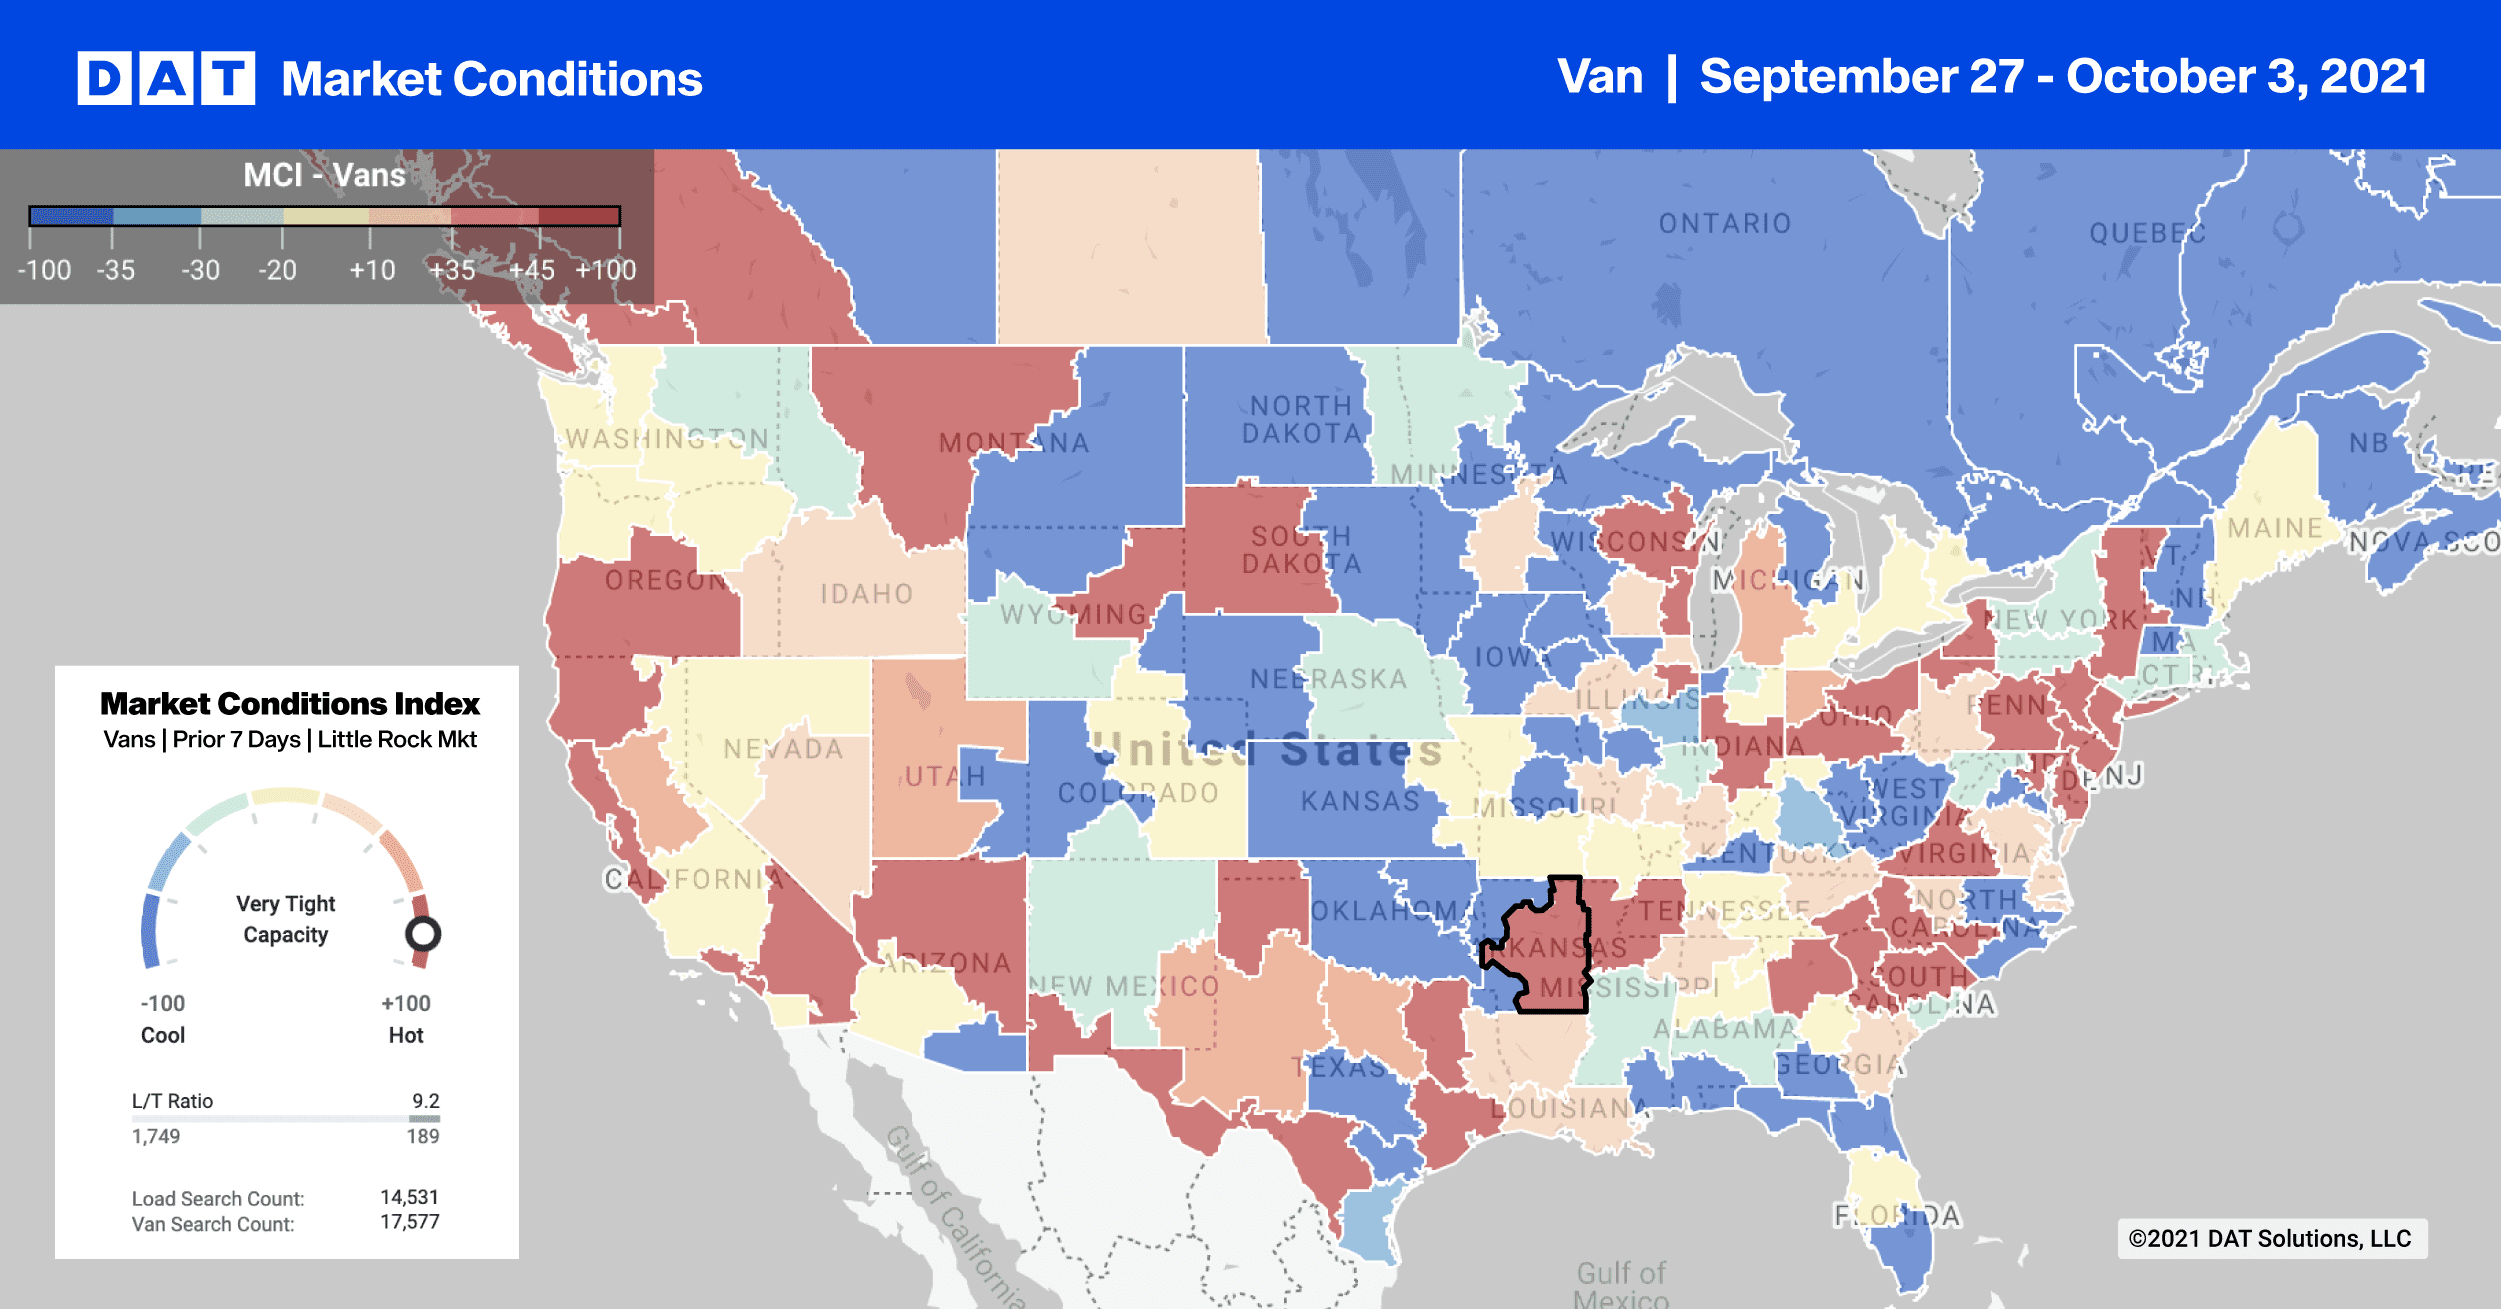
Capacity remains tight in Los Angeles where outbound average spot rates inched higher last week — up $0.01/mile to $3.26/mile on 2% higher volumes. On the high-volume lane from Los Angeles to Chicago, spot rates were up 5%, and loads moved increased by 19% as shippers looked to truckload to move urgent freight.
This is also a dominant intermodal lane where approximately 30% of all intermodal containers move. But with inland port congestion clogging up major freight hubs like Chicago, DAT has seen spot rates up 18% and load volumes increase by 72% compared to this time last year.
Spot rates
Higher end-of-month volumes pushed dry van spot rates up last week by just over a penny per mile to a national average of $2.53/mile. Compared to the same week last year, dry van rates are still 12% or $0.30/mile higher.
Of our Top 100 lanes (for loads moved), spot rates:
- Increased on 40 lanes (compared to 35 the week prior)
- Remained neutral on 36 lanes (compared to 33)
- Decreased on 24 lanes (compared to 32)
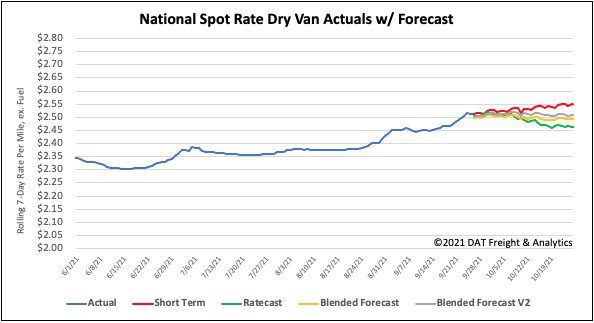
How to interpret the rate forecast:
- Ratecast: DAT’s core forecasting model
- Short Term Scenario: Formerly the pessimistic model that focuses on a more near-term historical dataset
- Blended Scenario: More heavily weighted towards the longer-term models
- Blended Scenario v2: More heavily weighted towards the shorter-term models


