Last week we reported on several reliable and unbiased industry volume indices (ATA Truckload Tonnage, Cass Freight Index and MSU Surface Transportation Index), which all indicated overall truckload freight volumes are still down year-over-year. This week we take a look at two more freight volume indices.
DAT iQ Pulse Signal: Our monthly report based on data from shipper members of the Freight Market Intelligence Consortium showed that the total volume of dry van freight for September was only 1.6% above September 2019, but the volume increase did not appear to be network wide – instead, it was concentrated.
There is still a bifurcation of shipper volume, with winners and losers mostly along industry lines, with quite a bit of variability within industries as well. Interestingly, those shippers with very high truckload volumes in Q2 (essential retail, packaged food, cleaning supply manufacturers) generally saw a decrease from those peaks in Q3, while those shippers with severe drops in Q2 (most industrials and non-essential retailers) experienced increased volumes in Q3.
In contrast to dry van volumes, FMIC contract volumes in the temperature-controlled were down 12% y/y in September.
Tune into DAT iQ Live, live on YouTube or LinkedIn, 10am ET every Tuesday.
U.S. Bank: Reports that the third quarter Freight Payment Index, which represents more than $28.8 billion in freight payments annually in the truckload and LTL sectors, indicated freight shipments were down 7.6% y/y, with freight spend also down by 7.3% y/y. “Not all trucking sectors or shippers saw freight growth during the third quarter though,” according to the U.S. Bank. “For example, some parts of the tanker truck industry continued to struggle with the lower energy consumption and production, as well as soft chemical output. Flatbed carriers hauling for residential construction witnessed strong volumes, but the industrial side of flatbed freight was less robust.”
Last week’s much-anticipated release of gross domestic product (GDP) number for the third quarter showed the economy had increased at a 33.1% annual rate, but GDP is still lower than it was before the pandemic. Adjusted for inflation, real GDP is down 2.8% compared to the Q3 in 2019, however, the goods component of GDP increased at a much faster rate than services last quarter.
Typically, spending on services makes up more than half of all economic activity (services include health care, education and financial services), but as a result of the pandemic, consumer spending on services in the third quarter was down by 5.78% or $551 billion lower than the same period in 2019, while spending on goods was up $301 billion or 6.2% q/q.
This has resulted in carriers having more freight to haul this year for certain commodities, such as fast-moving consumer goods that need constant replenishment and on-off expenditures on motor vehicles (up 11.42% q/q), furniture (up 12% q/q) and recreational goods (up 16% q/q). In the non-durable good sectors, food and beverage expenditures were up 9% q/q while clothing and footwear was down by the same amount according to the Bureau of Economic Analysis.
The current rise in COVID-19 cases would suggest the current freight volume imbalance at the commodity and lane level is likely to continue well into 2021 as consumers dig in for the long-haul.
Dry van trends
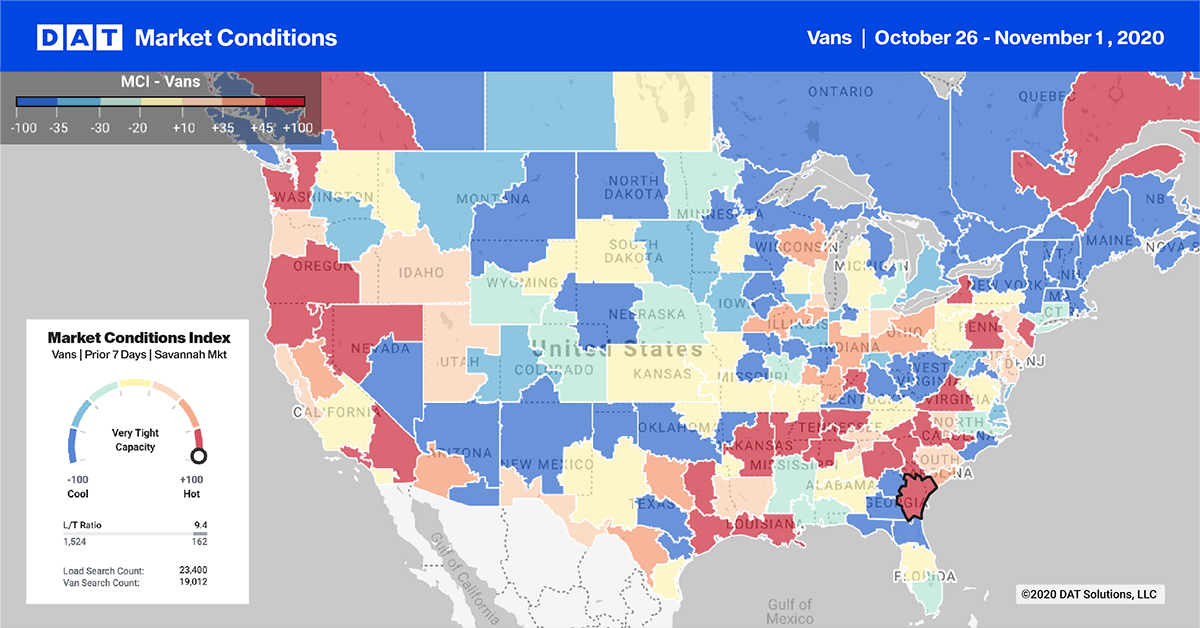
> Learn more about the Market Conditions Index
Last week we got a reminder that hurricane season is not over, as Hurricane Zeta took aim at the Gulf Coast last Wednesday night as a category 2 hurricane. Even though it was a fast-moving storm, it left close to two million homes and businesses without power across several states, including Louisiana, Mississippi, Alabama and Georgia. Zeta was the fifth named storm to make landfall in the state of Louisiana during a single year — the highest number since the state started keeping records in 1851.
In the New Orleans freight market inbound load post volumes were down on average 4% w/w for all equipment types and on the outbound side, volumes were also down 11% w/w for both flatbed and reefer but up 8% w/w for dry van after some early shipments before the hurricane made landfall.
End-of-month volumes in our top 10 freight markets increased outbound load posts by 10% w/w led by the West Coast for the second week in succession as record levels of imports arrived from Asia. Volumes in the Ontario (#1) and Los Angeles (#2) increased by 27% w/w and 20% w/w respectively. Outbound rates in both markets were up $0.06/mile last week to $3.09/mile and $3.02/mile respectively. Further north in San Francisco (#53) volumes jumped 20% w/w and in the Pacific Northwest volumes spiked 32% w/w in Seattle (#22). In the southeast the Atlanta market took number one position for the most inbound load posts with a 10% w/w increase and about the same increase for outbound loads. Memphis (#4) volumes continue to decline dropping by 8% w/w although capacity remains tight as rates moved up $0.05/mile to $2.57/mile.
Reefer trends

Reefer truckload capacity in the Pacific Northwest remained tight last week, as spot rates increased by $0.07/mile to $2.39/mile – regionals volumes were up 27% w/w. The USDA reported a shortage of trucks in the Twin Falls, ID, market for potatoes and onions, as outbound load post volumes spiked 31% w/w. Reefer rates jumped $0.09/mile to $2.53 for loads outbound from Twin Falls.
A shortage of trucks was also reported for loads of apples and pears in the Pendleton market, where volumes were up by 26% w/w pushing rates up $0.07/mile to $2.37/mile. Further south in Fresno (#10) outbound volumes were up 14% w/w with capacity tightening as rates moved up by $0.04/mile to $2.63 and in the neighboring Ontario market volumes jumped by 39% w/w. Capacity in Ontario eased slightly last week as rates dropped $0.02/mile to $3.10/mile.
On the east coast in Elizabeth (#1) and Philadelphia (#5) outbound volumes increased by 7% and 11% respectively – rates remained much the same at $2.10/mile and $2.43/mile respectively. The largest increase in volume last week was recorded in Charlotte where load posts increased by 59% w/w with 17% of loads destined for Harrisburg followed by 5% to Philadelphia. Capacity in Charlotte eased slightly as rates decreased by $0.02/mile $2.11/mile.
Flatbed trends

The U.S. Bank Freight Payment Index for the third quarter highlighted some of the recent activity we’ve been reporting in the southeast, where around half of all new single-family homes are built each year.
Even though shipments were down nationally, the southeast was the strongest region during the third quarter and included gains in both shipments and spend. U.S. Bank noted, “this is the result of more factories restarting production, as well as solid home-building, consumer spending and even some increased, though limited, summer vacation travel to the region. Freight also rose in anticipation of an active hurricane season.”
Freight shipments increased in the southeast by 12.5% from quarter two, leaving shipment volumes up 5% y/y – the only region in positive territory in the last quarter.
Overall outbound load post volume in our top 10 flatbed load post markets increased by 2% w/w although some of our larger flatbed volume markets reported notable declines. The lumber-rich Portland (#5) and Medford (#6) markets recorded a decrease of 5% w/w and 30% w/w respectively and in the southeast Alabama market, volumes were down 20% w/w (Birmingham, Montgomery and Decatur). Memphis (#2) lost its number one place to Little Rock last week following a 24% w/w drop in volume. In contrast, volumes in nearby Little Rock jumped by 24% w/w with rates remaining flat at $2.75/mile.


