With freight markets already upended by COVID-19, supply chains are in a precarious position heading into hurricane season. Further complicating matters: This season is expected to be an especially active one.
For freight and logistics professionals, that makes the most up-to-date and accurate data all the more valuable. And with the recent addition of the Freight Market Intelligence Consortium, formerly of Chainalytics, DAT iQ offers the clearest view of the entire trucking industry to help businesses navigate the darker waters ahead.
Below are some of the trends we’re seeing play out in the marketplace, with forecasts for where prices are heading.
Dry van trends
A cross-border trade deficit with Mexico is causing freight imbalances on the southern border. Compared to June 2019, overall trade with Mexico is down, exacerbated by the pandemic.
According to the Census Bureau, Mexico ranked number two in total trade with the U.S. in June 2020, with the Laredo market accounting for 38% of all cross-border trade and 43% of daily truck crossings. To illustrate the market imbalance, last week Laredo inbound loads (U.S. exports on their way to Mexico) were up 38% month over month, while outbound loads (imports) were down 25% m/m, which resulted in tighter capacity as carriers were more selective about loading into the border market. As a result, outbound spot rates increased by 3% m/m to $1.95.
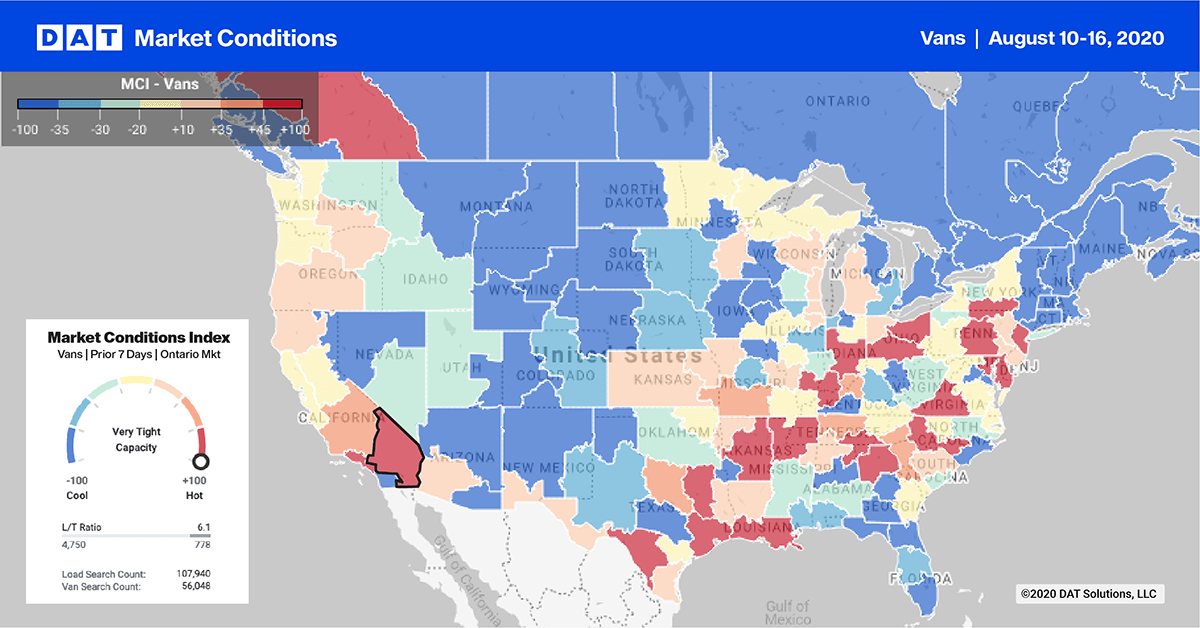
Anticipate changes in supply and demand with the Market Conditions Index.
The Denver market reported a 2% w/w increase in outbound dry van loads. In the Great Lakes region, load volumes in the Milwaukee market are up 5% w/w and 27% y/y after increasing for the fifth week in succession. Spot rates have followed suit in both markets.
The rate of increase in dry van prices did appear to be slowing last week and leveling off at a national average of $2.02/mile (excluding fuel), just 2 cents lower than the peak in 2018. Rates are still at the highest level seen in the past five years for mid-August and currently up 25% y/y. The Ratecast predictive model from DAT iQ expects dry van rates to continue plateauing, with dry van rates hovering in the $2.00 to $2.05/mile range over the next four weeks, which is consistent with our short-term outlook that the freight market is stabilizing.
Reefer trends
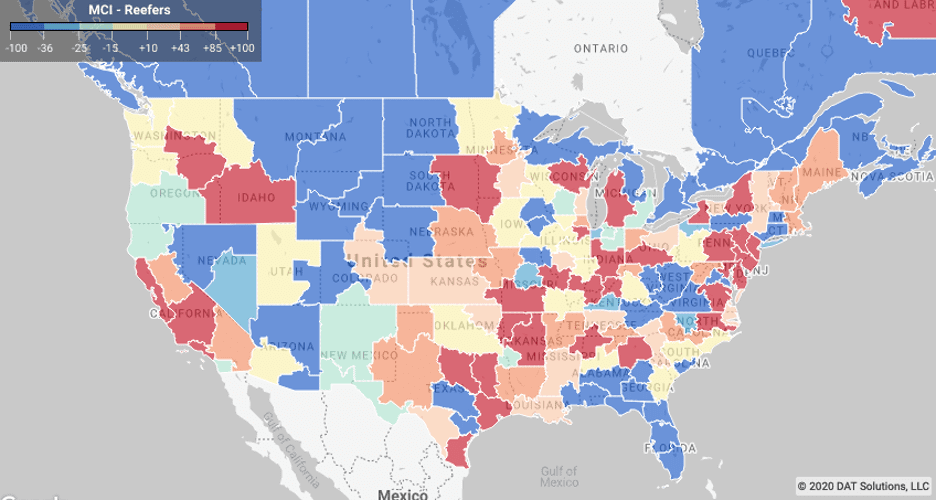
The Buffalo market in upstate New York is reporting strong volumes as summer produce shipping season hits top gear. New York is the number two cabbage producing state behind California, and with the season now four weeks in, reefer capacity is tight. Buffalo reefer loads volumes are up 30% w/w and 108% m/m. Outbound spot rates also increased by 12% w/w and are significantly higher than the national average.
In Southern Idaho, the Twin Falls market continues with strong volumes, which are up 60% m/m and 23% w/w. About 6% of those loads were destined to Seattle for the export market, followed by 5% of loads to both Miami and Atlanta.
This week’s, the USDA reported seasonal year-over-year volumes of produce decreased by 3% for domestic and 12% for imported truckload shipments, which is just under 2,500 fewer loads of produce compared to the same week in 2019.
A shortage of trucks continues for watermelons and cantaloupes in Maryland, Delaware and Eastern Shore Virginia, Southwest Indiana, Southeast Illinois, North Carolina, and Southeast. A slight shortage of trucks was reported for peaches, nectarines, plums, and grapes in the San Joaquin Valley and avocados in South District California. A slight shortage of trucks was also reported for onions in Southern New Mexico, and apples, pears, cherries, peaches, nectarines, and prunes in the Yakima Valley & Wenatchee District in Washington.
National average reefer rates moved up slightly, increasing by 1 cent to $2.20/mile (excluding fuel), which is now 38 cents higher than the same week in 2019 and 8 cents higher than 2018 when capacity was much tighter. Even though August is typically peak shipping month in the produce sector, spot market volumes at the midpoint in August appear to have reached a peak, as reefer load posts begin to decline. Our flagship Ratecast model is predicting reefer rates have the potential to increase another 4 cents over the next four weeks.
Flatbed trends
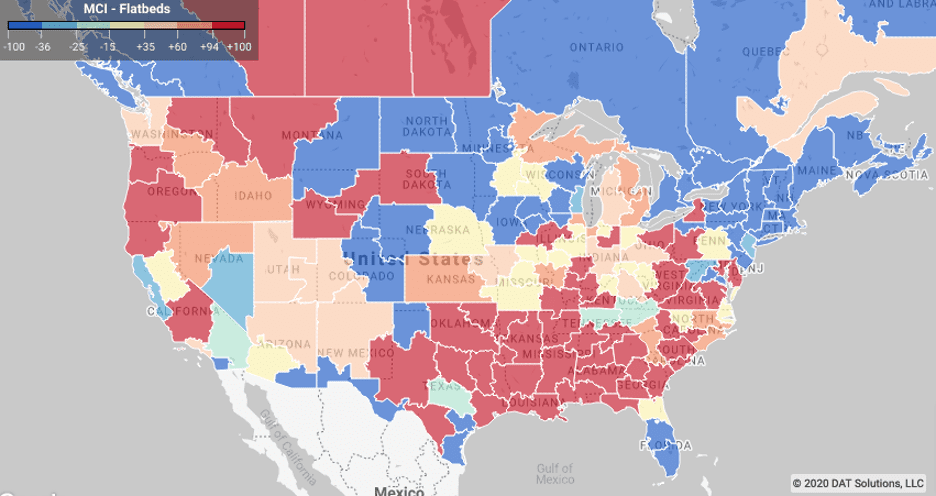
As strong as spot market demand and rates have been recently for vans and reefers, the longer-term outlook for flatbeds appears to be the most bullish. That’s on the strength of new home construction, which jumped up 23% in July, according to the US Census Bureau. Building permits also rose by 19% in July, fueled by low interest rates. All of these are positive indicators for future building activity, which will create more demand for flatbeds.
Early in the pandemic, there was a surge in demand for lumber and construction materials, with people tackling home improvement projects while they were on lockdown back in March and April. Oregon is the top lumber-producing state, and flatbed volumes from Portland keep climbing. They were up another 12% last week, with a quarter of those loads heading to Southern California.
Volumes did drop in the Southeast, so there are some signs of demand cooling in the short term, but if you look supply and demand charts in DAT MembersEdge or DAT Power, you can see that those markets are still hot. The declines from the lumber markets in that region are most likely a result of some of those depleted inventories having been replenished.
But long term, the construction sector still proves to be resilient in the face of the pandemic, which is a strong sign for flatbed freight going forward.
Flatbed spot rates increased slightly to $2.04/mile. Flatbed rates are now 10% higher y/y but are showing signs of having reached their peak, as load posts plateau. Over the next four weeks, our Ratecast model expects rates to drop back to the $2.00/mile mark, with the threat of an above-average hurricane season the major factor to watch in the longer-term direction of rates as we head into the fall.


