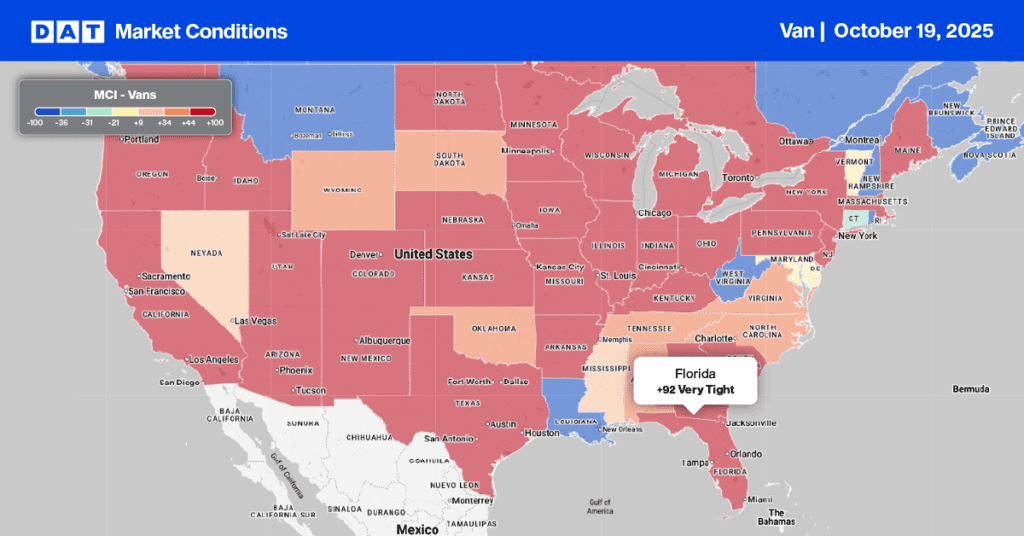
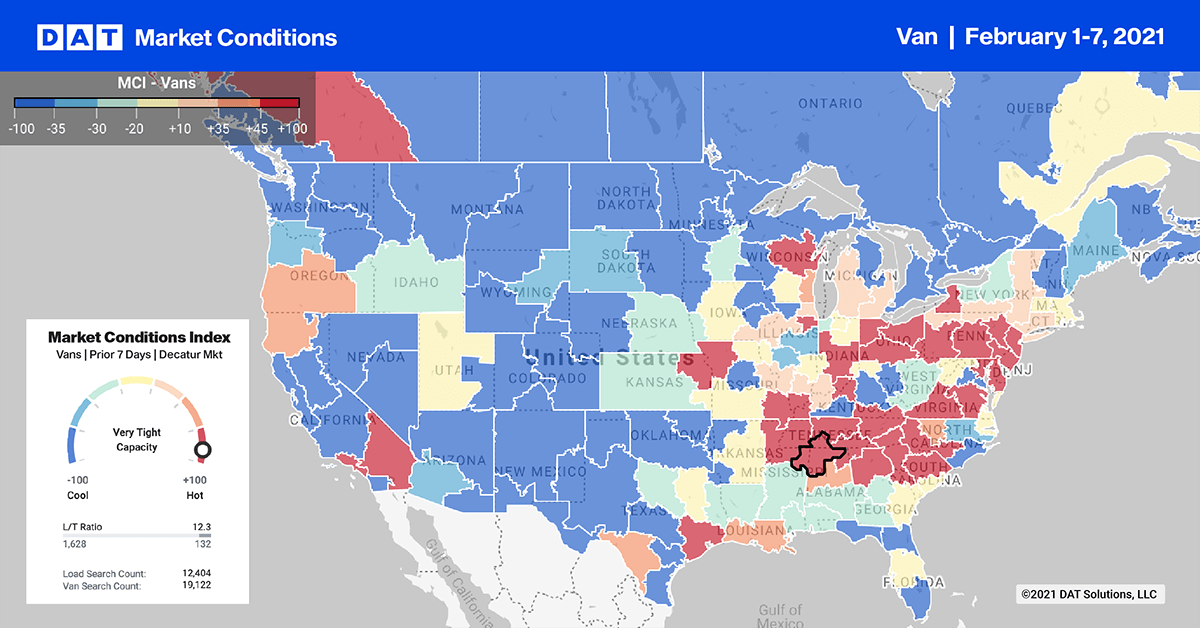
Dry van load post volumes on the DAT network increased 7% last week and are now up 121% year over year. The number of available trucks on the spot market was essentially unchanged, and the load-to-truck ratio remained at 4.55.
The average spot van rate was higher on 58 of DAT’s top 100 van lanes by volume, although the number of loads moved on these lanes declined 2.8% compared to the previous week.
Van load post volumes increased 5% week over week in our top 10 markets, although, following the national trend, capacity and rates were relatively flat.
Find dry van loads and trucks on the largest on-demand freight exchange in North America.
Manufacturing activity picks up
The Institute for Supply Management’s manufacturing index slipped to 58.7% in January from 60.5% in December, its highest point in almost two and a half years, and close to a 16-year peak. ISM said absenteeism, short-term shutdowns to sanitize facilities and difficulties in returning and hiring workers continue to limit manufacturing growth potential.
For carriers, the good news is that of the 18 manufacturing industries tracked each month, five of the six largest ones—chemicals; metal; transportation equipment; food and beverages; and electronics), showed moderate to strong growth in January.
Ports in a storm
Port markets continue to experience swings in demand for trucks. Volumes in Elizabeth, N.J., increased 7% compared to the previous week, and the average outbound rate rose 3 cents to $1.90/mile. On the West Coast, outbound load volume from Los Angeles dropped 14% week over week; in Ontario, the decline was 8%. Tighter capacity in both markets lifted the average outbound rates by 2 cents to $2.35/mile and $2.43/mile, respectively.
Spot rates
After skidding through January, spot van rates found their footing around the $2.05/mile mark as a national average. That’s 54 cents higher than during the same week in 2020, when the van rate averaged $1.51/mile.
However, spot van rates are now lower than contract rates, which are up 16% year over year. When routing guides hold up and carriers accept more loads at higher contract rates, you can expect downward pressure on spot rates in the future.

How to interpret the rate forecast
1. Ratecast Prediction: DAT’s core forecasting model estimate showing continued optimism and rate growth.
2. Short Term Scenario: Formerly the pessimistic model that focuses on a more near-term historical dataset.
3. Blended Scenario: More heavily weighted towards the longer-term models.
4. Blended Scenario v2: More heavily weighted towards the shorter-term models.
> Learn more about Ratecast predictions available in RateView.