September finished strong for flatbed freight, but load counts have drifted down during the month of October. Flatbed rates have also drifted lower. Manufacturing has slowed and there has been a reduction in active oil wells, which has hurt the flatbed markets.
Even though flatbed demand is down compared to last month, we are seeing pockets of activity spread throughout the country, and several of the major flatbed lanes improved last week. In fact, in the top 78 flatbed lanes, more lanes rose than fell last week.
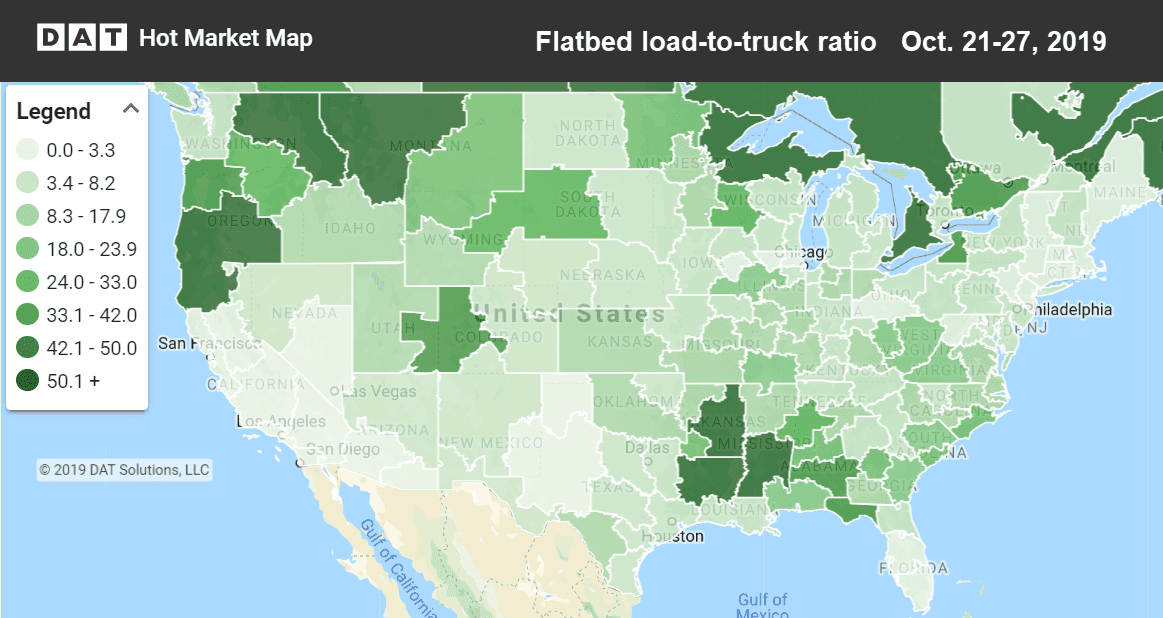
Hot Market Maps in DAT Power and DAT RateView show where trucks are hardest to find. The darker the color, the less competition there is for truckload freight.

Flatbed load counts and load-to-truck ratios finished September strong, but have drifted down in October. (Graph from DAT RateView.).
Rising Markets and Lanes
Last week rates increased in three flatbed markets representing different corners of America: Phoenix, Tampa, and Harrisburg, PA. In addition, some of the largest lane rate increases came from the midsection of the country.
- Houston to Wichita jumped 38¢ to $2.51/mi.
- Memphis to Tulsa increased 36¢ to $3.11/mi.
- Cleveland to Roanoke rebounded 45¢ to $2.92/mi.
- Reno to Watsonville, CA gained 39¢ to $3.53/mi.
Falling Markets and Lanes
Earlier in the month, Jacksonville, FL and Savannah, GA were strong points, but they had sharp dips in prices last week. Both cities are on the Atlantic Coast, which may indicate soft volumes at the ports. Several lanes also experienced steep rate declines.
- Savannah to Greer, SC (an inland Port) fell 42¢ to $2.61/mi.
- Baltimore to Springfield, MA dropped 46¢ to $3.14/mi.
- Rock Island, IL to Grand Rapids, MI moved down 41¢ to $2.45/mi.
- Birmingham to Raleigh, NC plunged 54¢ to $2.13/mi.
RELATED: Van volumes keep rising. When will rates?
Find loads, trucks and lane-by-lane rate information in DAT load boards, including rates from DAT RateView.


