As we reach the five-month mark of the pandemic, the freight market has yet to reach any semblance of equilibrium – capacity is tightening, spot market rates and volume are still climbing, and carrier networks are still out of balance. And that was before Hurricane Laura made landfall in the Gulf.
Here are several recent data points to note:
FMIC Pulse Signal Report: In the August edition of this DAT iQ report, the Freight Market Intelligence Consortium (formerly part of Chainalytics) reported total shipping volume remained flat in July, but the percentage of total truckload freight moving on the spot market increased from what had been a steady 12-15% of the market to 21%. That pushed overall spot market volumes up 2.1% month over month, according to the DAT Truckload Volume Index – 3.7% higher than in July 2019.
The numbers show that asset-based carriers are honoring their committed volumes to shippers, but not necessarily providing additional surge capacity, which pushed more freight to the spot market. Volatility in shipper networks has also created new lanes that need to be covered, which also fell predominantly to the spot market. While there are enough trucks out there, they are not in the right places.
Cass Freight Index Shipment: As a measure of economic actively mostly in the industrial manufacturing sector, the Cass Freight Index Shipment showed July freight volumes had increased by 4.8% month over month but still remained down 13.1% year over year.
ATA Tonnage Index: In contrast, the ATA Tonnage Index (widely regarded as a mix of retail and industrial freight volumes) reported July truckload tonnage dropped by 5.1% m/m after increasing 8.9% m/m in June. Year-over-year volumes for July are also down 3.2%.
“The drop in tonnage is likely because many fleets didn’t have the capacity to take advantage of stronger retail freight volumes, with a majority of the overflow freight moving to the spot market,” according to ATA Chief Economist Bob Costello.
As the summer of the “staycation” draws to an end and the new school year begins, shippers normally begin to ramp-up inventories for the upcoming holiday retail season, but that’s in a normal non-pandemic year. Absent another stimulus package from Congress against the backdrop of increasing jobless claims, there are concerns that consumer confidence is wavering, based on the Survey of Consumer Confidence from the University of Michigan.
Since trucking doesn’t create demand, when and where consumers plan to spend their dollars this retail season will determine the pace and direction of the economic recovery.
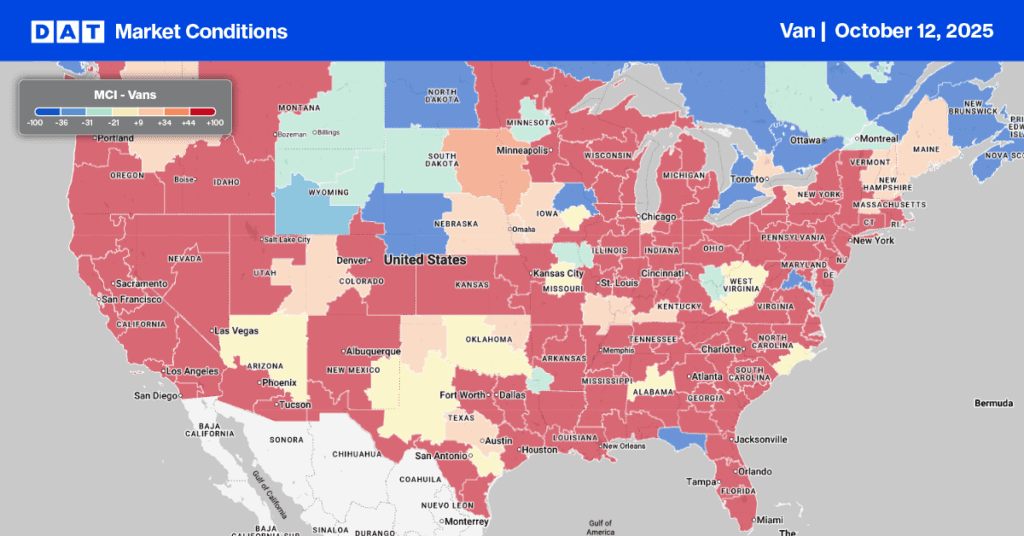
Dry van trends
Anticipate changes in supply and demand with the Market Conditions Index.
Spot market outbound load volumes on the West Coast continue to lose steam, dropping by 5% w/w in the import-heavy Los Angeles and Ontario, CA, markets, although capacity was tighter last week increasing average outbound rates by just under 1%. Rates are now up 8% m/m after increasing for the last four weeks in succession. Notable load destinations included the warehouse markets of Stockton, CA, and Phoenix, which received a combined 12% of loads. Salt Lake City received just over 4% of loads from Ontario and Los Angeles last week, but for inbound carriers there has been somewhat of a surge in outbound volume over the last month to keep them busy.
Salt Lake City load volumes are up 18% w/w and 43% m/m, driving up rates by 9% last week to an average of $1.70/mile. In the Midwest, the Illinois markets of Joliet and Chicago have been reporting stronger outbound volumes, which have increased by 2% w/w and 27% m/m contributing to higher outbound rates ending last week at $2.48/mile, an increase of just under 2% w/w and 9% m/m.


National average rates provided by DAT iQ.
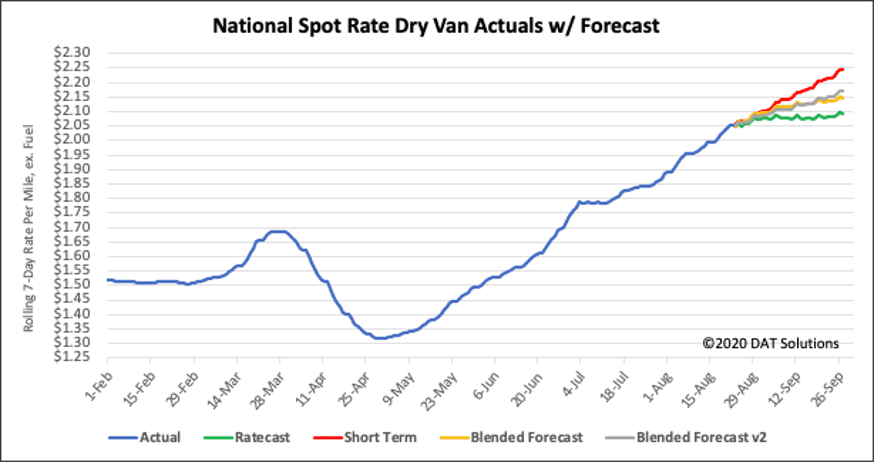
Despite showing signs of plateauing in recent weeks, dry van rates inched higher last week, rising by 4 cents to end the week at $2.05/mile (excluding fuel). Rates are still at the highest level seen in the past five years for late-August and are just 2 cents lower than the record 5-year peak recorded on July 2, 2018.
The Ratecast predictive model from DAT iQ expects dry van rates to continue in the $2.05 to $2.09/mile range over the next four weeks, which is consistent with our short-term outlook that the freight market is stabilizing. There is still upward pressure on spot rates based on tighter overall capacity though. In the recent ATA Truckload Tonnage report it was noted that for-hire truckload fleets are operating 3% fewer trucks this summer than 2019, making it more difficult for them to take on additional freight creating more spot market volume for carriers.
Forecasting during this volatile period is difficult. Our team is working diligently to update and adjust the models, but new information becomes available at a rapid pace. DAT would typically not publish these types of preliminary studies, but we feel that the benefit of sharing our observations far outweighs the risk. We ask that you please treat these statements and exhibits as directional and consider them as a variable in your own analyses.
How to interpret the rate forecast
- Ratecast Prediction: DAT’s core forecasting model
- Short Term Scenario: Formerly the pessimistic model that focuses on a more near-term historical dataset.
- Blended Scenario: More heavily weighted towards the longer-term models.
- Blended Scenario v2: More heavily weighted towards the shorter-term models.
> Learn more about rate forecasts from DAT iQ
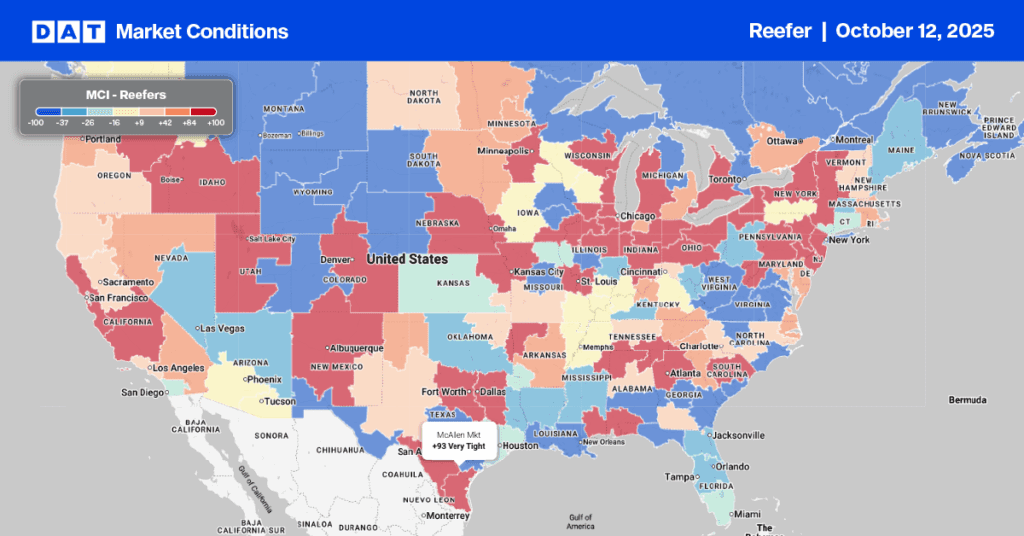
Reefer trends
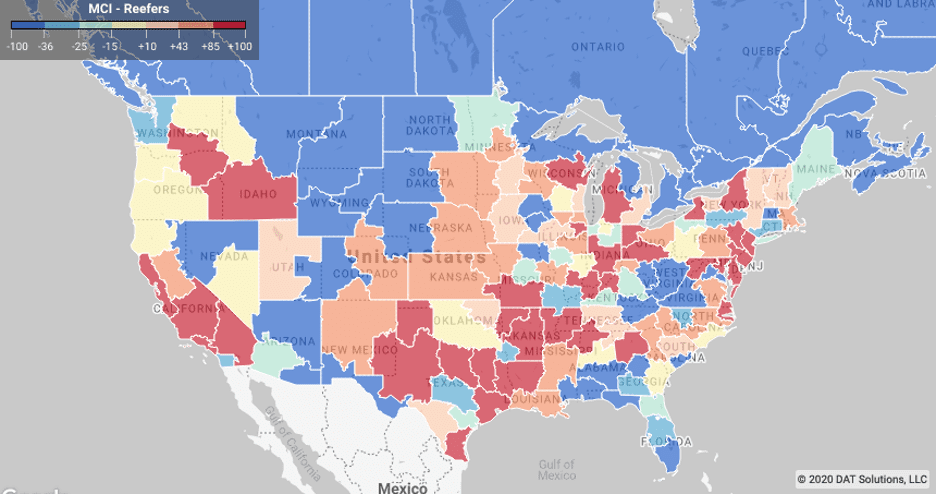
Anticipate changes in supply and demand with the Market Conditions Index.
As we move closer to the peak in Hurricane season, we’re seeing a lot more outbound load volume in all nine markets that surround the Gulf of Mexico. In the last week outbound volumes are up 5% w/w and up 14% m/m along with spot rates, which have also increased by 13% w/w. The combination of month-end and Hurricane Laura this week resulted in a continuation of higher outbound volumes earlier this week, as shippers rushed to move freight off their docks.
In the Midwest, outbound reefer volumes spiked in Joplin last week, increasing by 26% w/w and 51% m/m. Available capacity is also very tight in the Joplin market, putting upward pressure on spot rates, which increased 5% w/w to $2.34/mile. With Hurricane Laura expected to dump heavy rain in the Midwest later this week, we should see a further tightening of reefer capacity and higher spot rates.
This week’s USDA produce shipment report reported seasonal year-over-year volumes of produce decreased last week by 6% for domestic loads but increased by 24% for imported truckload shipments, which translates to just over 1,300 fewer loads of produce compared to the same week in 2019.
The USDA also reports a slight shortage of trucks for carrots and grapes from Kern District California, berries, broccoli, cauliflower, celery, lettuce, Romaine, and leaf lettuce from Salinas-Watsonville and Sant Maria California and citrus and avocados from South District California. Trucks were in demand in Columbia Basin Washington, Big Lake and Central Minnesota for loads of potatoes as well as limes, mangos, tomatoes, broccoli, mixed fruits and vegetables from Mexico Crossings through Texas in the Laredo and McAllen markets.
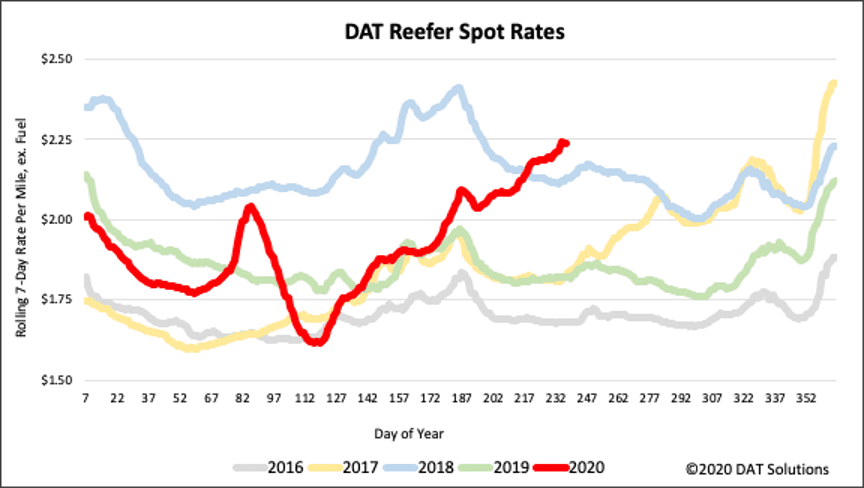
National average rates provided by DAT iQ.
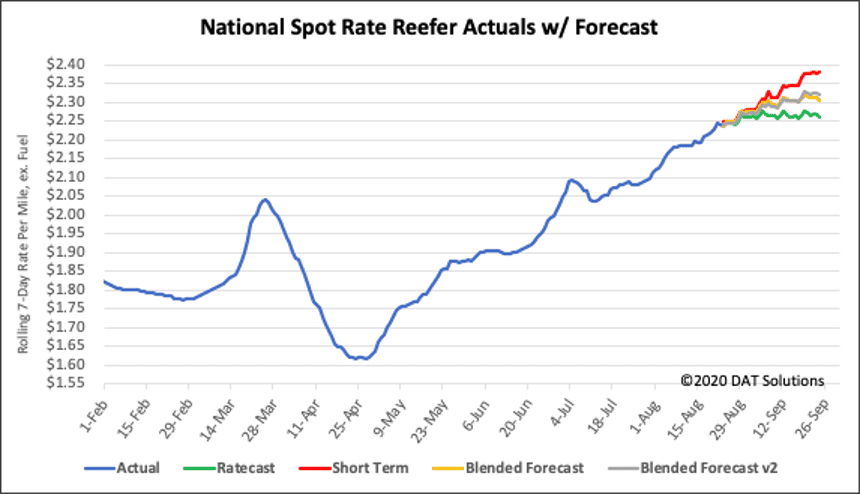
National average reefer rates are now well above 2017 levels after increasing 2% w/w to $2.24/mile (excluding fuel). Reefer rates are now up 19% y/y and at a 5-year record level for late-August.
The Ratecast predictive model from DAT iQ expects reefer rates to stay close to the $2.25/mile mark over the next four weeks – produce season still has a long way to go so we expect reefer demand to remain elevated.
Forecasting during this volatile period is difficult. Our team is working diligently to update and adjust the models, but new information becomes available at a rapid pace. DAT would typically not publish these types of preliminary studies, but we feel that the benefit of sharing our observations far outweighs the risk. We ask that you please treat these statements and exhibits as directional and consider them as a variable in your own analyses.
How to interpret the rate forecast
- Ratecast Prediction: DAT’s core forecasting model
- Short Term Scenario: Formerly the pessimistic model that focuses on a more near-term historical dataset.
- Blended Scenario: More heavily weighted towards the longer-term models.
- Blended Scenario v2: More heavily weighted towards the shorter-term models.
> Learn more about rate forecasts from DAT iQ
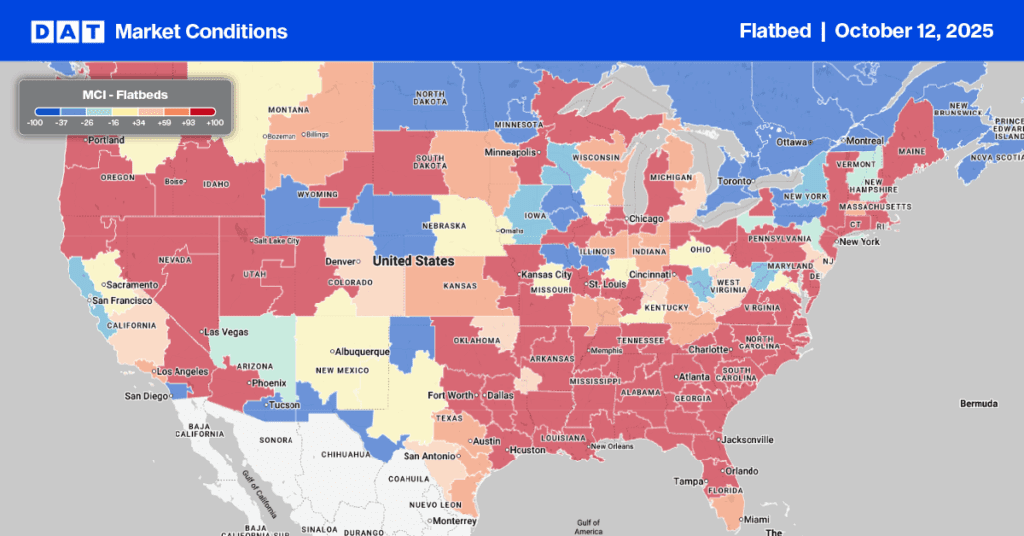
Flatbed trends
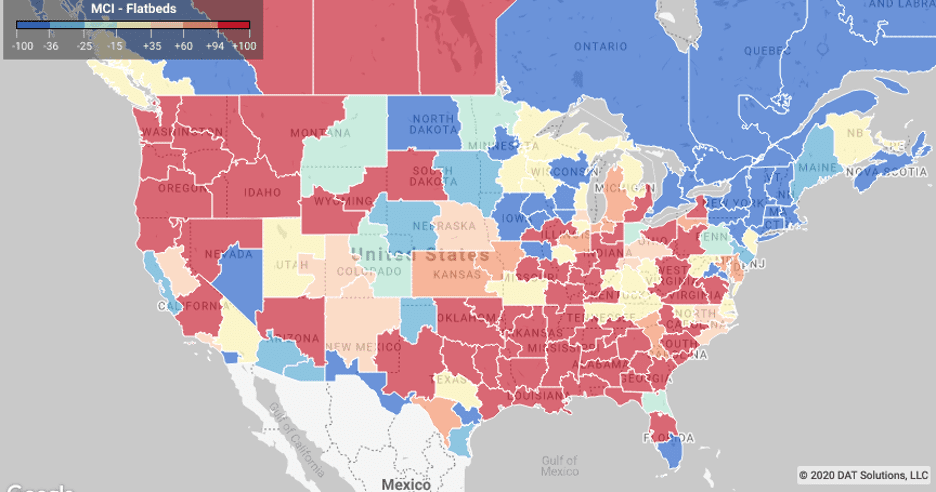
Anticipate changes in supply and demand with the Market Conditions Index.
Flatbed load volumes in the Southeast remained strong last week, with Gulf Coast markets reporting gains ahead of Hurricane Laura. New Orleans outbound volumes increased by 20% w/w with 10% of loads destined for the Boston market. Shippers and Brokers found plenty of available capacity though, which resulted in rates dropping 2% w/w. Neighboring Southeast markets, including Jackson, MA; Mobile, AL, and Montgomery, AL, also report higher volumes increasing by 22% w/w along with rates that also increased in the 3-4% range w/w.
Further south, the Lakeland, FL, market heated up last week with a spike in outbound loads (up 61% m/m), increasing rates by just under 3%. In contrast, outbound volumes dropped in the Baltimore market – the largest port market for imports and exports of roll-on/roll-off machinery – dropped 20% w/w. Available capacity in Baltimore was tighter last week, increasing outbound rates by just over 1% to $1.84/mile.
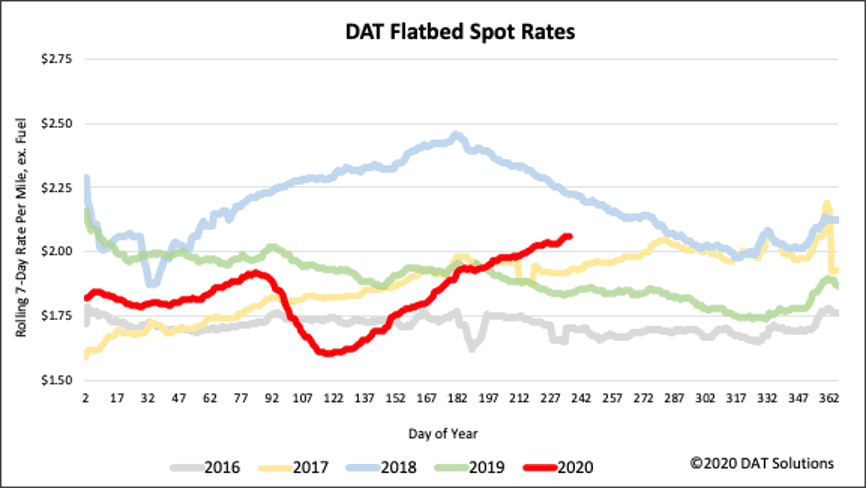
National average rates provided by DAT iQ.
Flatbed spot rates increased slightly to $2.06/mile (excluding fuel), up 2 cents from the week prior. Flatbed rates are now 11% higher y/y but still 19 cents lower than 2018.
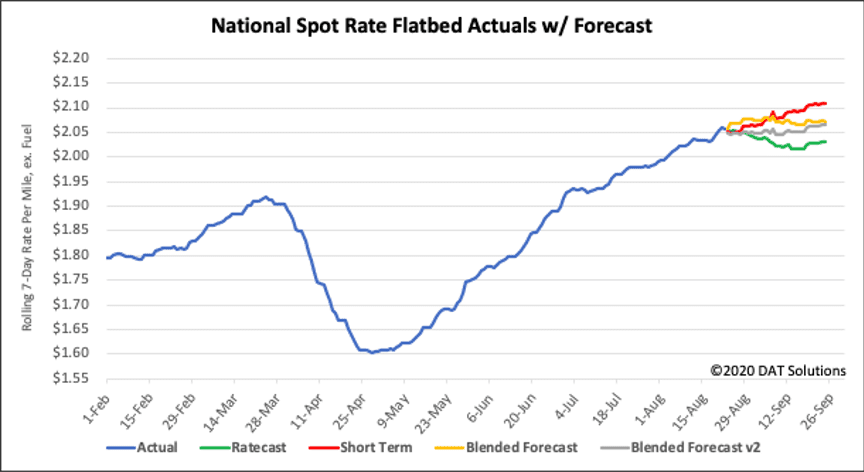
Over the next four weeks our Ratecast model expects rates to plateau in the $2.00/mile to $2.06/mile band, but with Hurricane Laura making landfall, we could see a repeat of 2017 when demand for flatbeds during the rebuilding effort (following Hurricanes Harvey and Irma) increased along with spot rates.
Forecasting during this volatile period is difficult. Our team is working diligently to update and adjust the models, but new information becomes available at a rapid pace. DAT would typically not publish these types of preliminary studies, but we feel that the benefit of sharing our observations far outweighs the risk. We ask that you please treat these statements and exhibits as directional and consider them as a variable in your own analyses.
How to interpret the rate forecast
- Ratecast Prediction: DAT’s core forecasting model
- Short Term Scenario: Formerly the pessimistic model that focuses on a more near-term historical dataset.
- Blended Scenario: More heavily weighted towards the longer-term models.
- Blended Scenario v2: More heavily weighted towards the shorter-term models.
> Learn more about rate forecasts from DAT iQ
Need more information?
Our update will be refreshed next week, or sooner if conditions change materially. We recommend that readers visit DAT.com/blog for the latest information. Any questions on this report or market conditions can be emailed to askIQ@dat.com.
We are also making available, free of charge, the DAT Daily 50 which is a daily report of the top 50 lanes by volume with a week’s worth of history and predictions using the Ratecast model.