Blueberry bushes can grow all over the U.S.; farmers in 26 states produce blueberries commercially. However, more than 98% of that production happens in just ten states, spanning the country from coast to coast: Oregon, Washington, Georgia, Michigan, California, New Jersey, North Carolina, Florida, Texas, and Minnesota. In Canada, British Columbia is the primary producing region for blueberries.
Get the clearest, most accurate view of the truckload marketplace with data from DAT iQ.
Tune into DAT iQ Live, live on YouTube or LinkedIn, 10am ET every Tuesday.
Imported blueberries account for around 70% of annual production, with Peru being the largest producing country, followed by Chile, Mexico, and Argentina. These farmers play a crucial role in keeping fresh blueberries on grocery store shelves throughout the year, especially during our winter months. Imports from Peru and Chile arrive in the Port of Philadelphia, which accounts for 37% of annual imported blueberry volume, followed by imports from Mexico (30%).
Seasonal production in the U.S. unfolds in a fascinating pattern. The Spring and Summer months witness a flurry of activity, with Georgia taking the lead in April and May. California growers join the harvest simultaneously, ranking third in annual production (6%). With its 7% share of domestic tonnage, the Pacific Northwest comes online in July and August. In Hammonton, NJ, known as the self-proclaimed Blueberry Capital of the World, the blueberry season in June is a highlight of the year. Last year, 15.3 million pounds were shipped, or about 360 (43,000 pounds) truckloads in weeks, resulting in very tight capacity for growers.
Market watch
All rates cited below exclude fuel surcharges unless otherwise noted.
According to the USDA, truckload capacity was tight last week in Central Florida and Nogales, AZ. Following the seasonal reefer capacity crunch in the lead-up to Mother’s Day in Miami, a slight shortage of trucks was reported for vegetable and watermelon loads, the latter representing just over a third of truckloads last week. Watermelon shipments typically peak in mid-May, but as of last week, shipments were 34% lower than last year, adding to states’ lower total produce volume, which is 6% lower year-over-year.
On the southern border in Nogales, AZ, a slight shortage of trucks was reported for vegetables on high-volume lanes west to California. Tucson market rates were up $0.15/mile to $2.21/mile on a 2% higher volume of loads moved. Nogales to Los Angeles paid carriers an average of $2.00/mile, up $0.05/mile w/w on a 10% lower volume of loads moved, while loads to Stockton, CA, averaged $1.71/mile on a 17% higher volume.
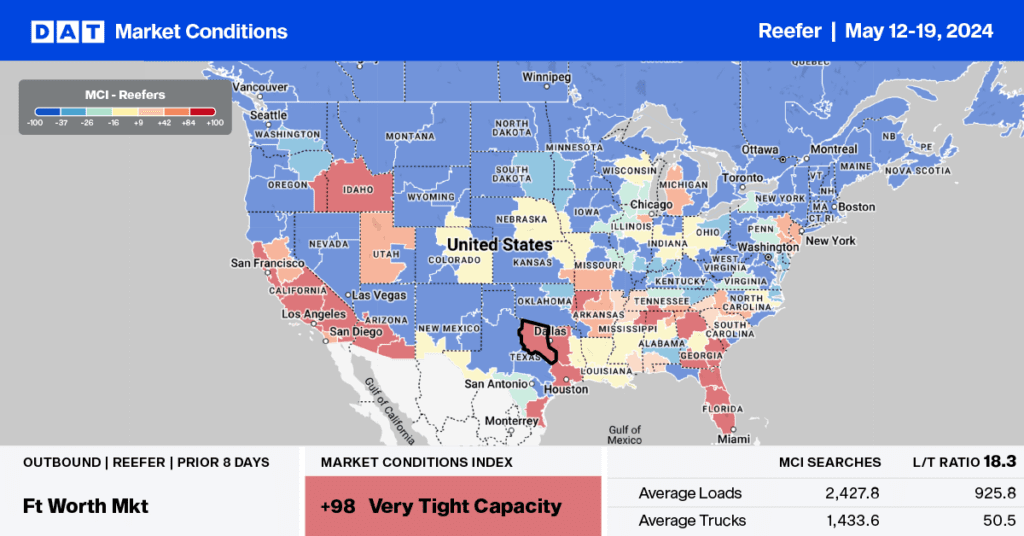
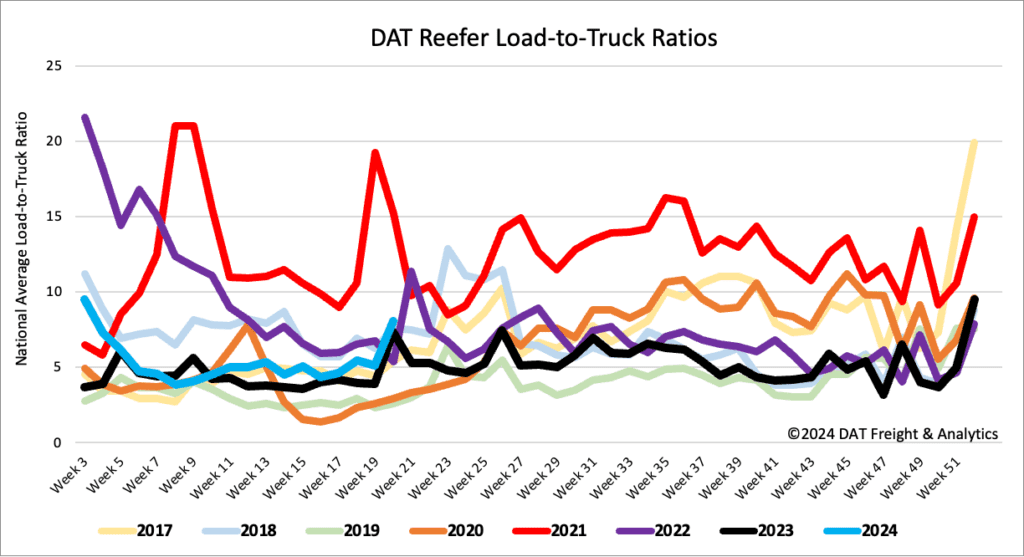
Load-to-Truck Ratio
More reefer carriers take time off during Roadcheck Week compared to flatbed and dry van operators, following last week’s 33% spike in load posts. Available capacity decreased, with equipment posts dropping 15% w/w (down 13% last year), increasing the reefer load-to-truck ratio by 57% to 8.04.
Spot rates
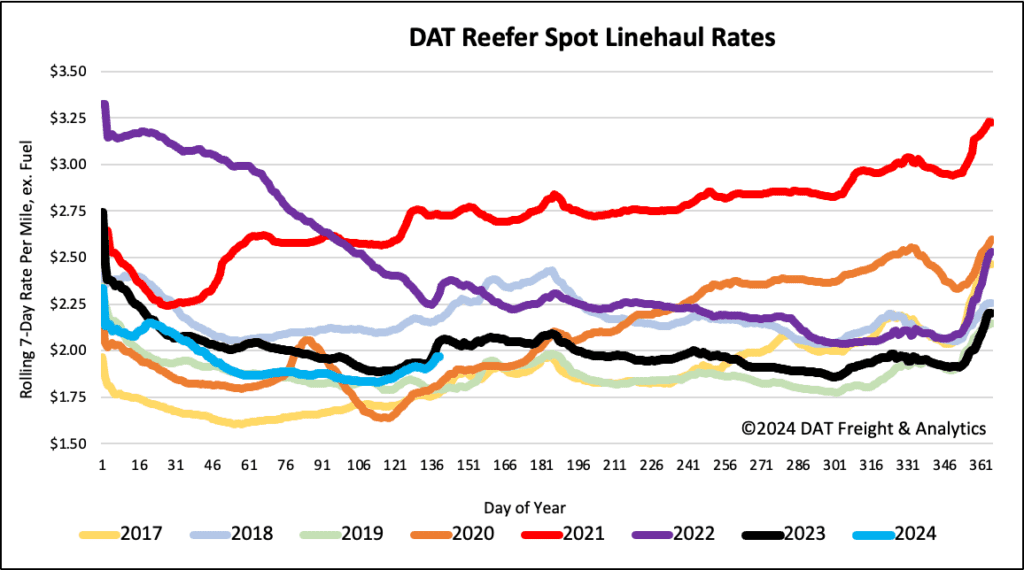
National reefer linehaul rates made the most gains during Roadcheck Week, increasing by $0.08/mile w/w for the fourth week. At $1.97/mile, reefer linehaul rates are $0.08/mile lower on a 1% higher volume of loads moved than last year.
