In the last 30 days, watermelons have dominated national truckload tonnage as the number one commodity shipped, a spot usually held by potatoes. In May, almost 765 million pounds, or nearly 18,000 truckloads of seedless watermelons, were shipped, followed by potatoes (596 million pounds) and apples (445 million pounds). According to the USDA, 55% of May’s watermelon tonnage came from Florida, 33% from Mexico, and 12% from Texas. The Florida season peaks in May each year, and then in June, production increases in Georgia, followed by California, Indiana, and North Carolina in July and August.
According to the USDA, growers in Georgia account for 18% of annual production, with Florida accounting for almost a quarter of all domestic watermelon tonnage in 2022. The largest watermelon supplier, though, is Mexico accounting for 26% of last year’s total volume. USDA data shows 62% of Mexican watermelons crossed into the U.S. via Nogales, AZ, in the Tucson freight market, followed by Progreso, TX, in the Rio Grande Valley region and McAllen freight market.
In California’s watermelon capital Manteca, the 28th Annual Crossroads Watermelon Street Fair held two weeks ago kicked off the season. Manteca, 14 miles south of Stockton, is the largest watermelon-growing region in California dating back to the turn of the last century, producing just over 4,500 truckloads between June and the end of September each year.
Market Watch
All rates cited below exclude fuel surcharges unless otherwise noted.
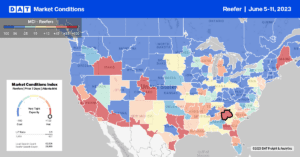
Our MCI index reported continued capacity tightness along the southern border last week, with the USDA reporting a shortage of trucks in Nogales for the third week. It’s watermelon season, and even though we only get around a third of our annual volume from Mexico, almost two-thirds cross into the U.S. in Nogales, AZ. Reefer rates in the Tucson market increased last week, jumping by $0.23/mile to an average of $2.70/mile. Short-haul loads to Phoenix paid $797/load or $4.438/mile, while 550-mile loads west to Los Angeles at $2.38/mile were $0.02/mile higher than the previous year.
In California’s largest produce region in the Fresno market, reefer rates surged last week, increasing by $0.12/mile to $2.32/mile, while loads out of the Salinas Valley reported similar weekly gains at an average of $2.26/mile for outbound loads. Fresno to Hunts Point, NY, at $2.42/mile, was $0.27/mile higher than the previous year, while loads from the nation’s salad bowl in Salinas paid $2.13/mile for the 3000-mile cross-country haul. After dropping since the start of the year, linehaul rates from Atlanta to Orlando at $2.66/mile were more than $0.30/mile higher than the May average. Florida reefer rates continue to cool as the produce season winds down following the Mother’s Day and Memorial Day peaks; outbound reefer rates have dropped by $0.37/mile in the last three weeks.
Peach season is underway in the Southeast, with reports of a shortage of trucks for loads of tomatoes in South Carolina (S.C.), according to the USDA. Outbound reefer rates jumped by $0.35/mile last week to $2.21/mile, with solid gains reported in the Columbia market, where rates increased by $0.21/mile to an average of $2.13/mile.
Load to Truck Ratio (LTR)
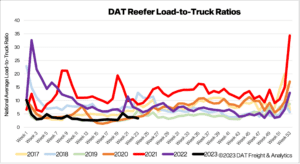
Reefer volumes dropped slightly last week, impacted by the slow start to produce season. According to the USDA, national produce volumes are 4% lower than last year, impacting overall reefer spot market volumes. Equipment posts were 13% higher last week and the highest since 2016, resulting in the reefer load-to-truck (LTR) decreasing slightly from 3.78 to 3.36.
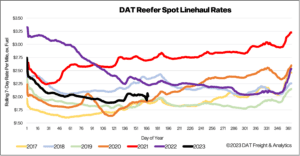
Spot Rates
After being flat for the prior three weeks, reefer linehaul rates increased by just under a penny per mile last week to a national average of $2.05/mile. Compared to the same time the previous year, spot rates are $0.25/mile lower than the last year and around $0.02/mile higher than the average in pre-pandemic years.