Last week’s release of the American Trucking Associations’ advanced seasonally adjusted (SA) For-Hire Truck Tonnage Index decreased 0.7% in May. This makes two consecutive months of lower volumes.
Compared with May 2020, the SA index rose 3.7%, which was preceded by a 6.7% year-over-year jump in April. Compared with the same five months in 2020, tonnage is up 0.4% since the beginning of the year according to ATA Chief Economist Bob Costello.
“Tonnage, despite falling slightly over the last two months, remains well above the lows of last year,” says Costello. “[This] is no small deal considering that truck tonnage fell significantly less than many other indicators during the depths of the pandemic in the spring of 2020.”
The May tonnage numbers also got a boost from higher gasoline demand due to increased demand for both commuting and vacation travel. According to the report, “trucking’s biggest challenges are not on the demand side, but on the supply side, including difficulty finding qualified drivers.”
ATA calculates the tonnage index based on surveys from its membership and has been doing so since the 1970s, making it one of the most reliable truckload demand indicators available today.
Find loads and trucks on the largest load board network in North America.
Note: All rates exclude fuel unless otherwise noted.
On the 372-mile run from Los Angeles to Phoenix, spot rates continue to climb reaching $4.44/mile this week. That’s a $0.12/mile increase since last week and up $1.42/mile since February. Spot rates reached $4.25/mile this week on the high-volume e-commerce lane from LA to Stockton’s warehouse market. That’s an increase of $1.16/mile since February this year.
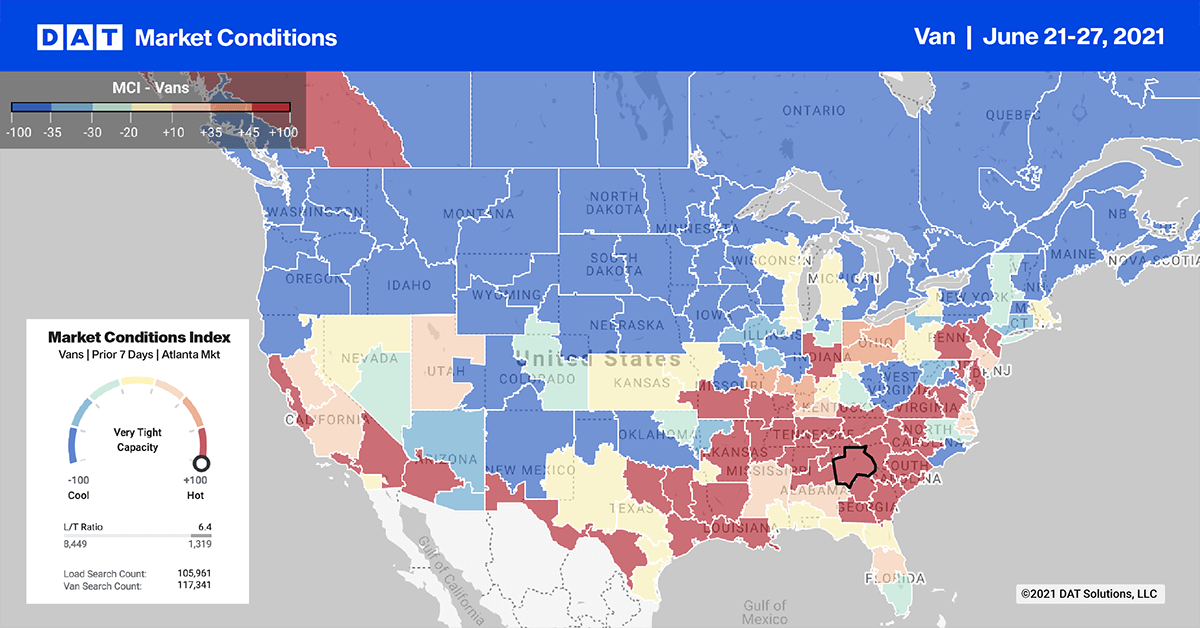
On the East Coast in Atlanta, spot rates for loads to Orlando are $3.89/mile this week, which is the highest we’ve ever recorded on the 440-mile lane. Rates are now up $1.08/mile since February also.
Spot rates
Seasonality returned to the market last week with dry van spot rates increasing by $0.03/mile to $2.38/mile. Dry van spot rates are still $0.78/mile higher than this time last year and $0.39/mile higher than in 2018.

How to interpret the rate forecast:
- Ratecast: DAT’s core forecasting model
- Short Term Scenario: Formerly the pessimistic model that focuses on a more near-term historical dataset
- Blended Scenario: More heavily weighted towards the longer-term models
- Blended Scenario v2: More heavily weighted towards the shorter-term models


