In May 2020, truckers were in Washington, D.C., protesting low freight rates. They claimed the low rates could force many of them out of business. Just 18 months later there’s more high-paying freight than truckers can handle.
Get the clearest, most accurate view of the truckload marketplace with data from DAT iQ.
Tune into DAT iQ Live, live on YouTube or LinkedIn, 10am ET every Tuesday.
The protests came immediately after the end of the initial pantry-stocking in response to the first lockdown phase of the pandemic in 2020, which resulted in surging freight volumes. Truckers’ concerns were legitimate as far as freight rates were concerned. But since then dry van spot rates have almost doubled, increasing to a national average of $2.56/mile, excluding the fuel surcharge this week.
The three-month period between May and July last year was rough for many truckers, though, especially those that didn’t receive loans from the federal government’s Paycheck Protection Program (PPP). For those that did manage to survive, it didn’t take too long before low diesel prices and rising freight rates meant record-high profit margins.
In fact, within 16-weeks of the Washington “Mayday” protests, diesel prices dropped $0.34/gal and dry van linehaul rates surpassed the highest rate recorded in all of 2018 — a freight cycle driven by the tightest capacity the industry had seen in a decade.
Since the pandemic began, the 2021 average dry van rate is currently 46% higher than the national average of the four years prior to the pandemic ($1.60/mile). This has fueled a new generation of owner-operators.
Some switched from being leased onto a larger motor carrier to becoming an independent contractor (IC) running under their own authority. But most were brand new to the industry. These new carriers purchased their own truck and trailer, a subscription to digital technology — including DAT One — and jumped straight into the IC freight sector.
Since April 2020, close to 100,000 owner-operators have been granted a new DOT number. This group represents 32% of all trucks added to the market. Fleets with 40 or fewer trucks accounted for 79% of trucks joining the industry during the same timeframe.
“We’re in the best trucking environment I have ever seen in my history of trucking in 30-plus years and for the first time average IC salaries have exceeded $70,000 per year,” notes Todd Amen, President and CEO of ATBS.
Why are things so good then?
Overall freight volumes are — at best — up slightly year-over-year. According to the American Trucking Associations’ (ATA) For-Hire Truck Tonnage Index, truckload tonnage increased by 1.8% compared to October 2020.
In a normal freight market where demand is strong, a rising tide lifts all boats. But not so during the pandemic where there have been winners and losers. Some commodities like retail freight have been experiencing exceptionally high demand whereas others have seen the exact opposite. For example, the automotive sector was hit hard due to the global semiconductor chip shortage.
Ongoing supply chain disruptions, inventory shortages and congested ports have created more urgency to move loads even if the trailer isn’t full. Using the OTIF (on-time in-full) shipper supply chain performance metric, being on time is currently regarded as being better than on-time and in-full. More part-loads with shorter lead times and low rates of first tender acceptance have driven double the volume of loads into the spot market compared to pre-pandemic years.
Using DAT’s extensive freight network based on $116 billion in annual freight payments, spot market volumes are currently running at just over 25% of total volume. In normal non-pandemic years, the volume moved on spot is closer to 12%.
Record-high spot market volumes and rates are also being driven by all-time high routing guide failures. Dry vans are currently at 20% and reefers are at 16% routing guide failure. This means that the more loads that are rejected by the primary carrier, the deeper the shipper must go in the routing guide to move a load — and the higher the rate.
How long will the good times last for carriers?
When will this end? The real answer is no one knows. But it will not be soon, and so long as spot rates are around current levels, carriers can expect the last six months to be a good guide as to how the first half of 2022 will play out.
According to Professor Chris Caplice, MIT Senior Research Scientist and DAT Chief Scientist:
“We are seeing double-digit increases in new rates coming into routing guides. And yes, we are seeing record spot rates, but spot rates are staying flat, which suggests the cresting of the market. Overall consumer demand seems to be peaking early, which could mean we will see a decline in the new year. Coupled with the Lunar New Year lull in shipping, it could provide enough of a break for the markets and ports to work out the congestion. Based on these factors, we expect the truckload market to remain elevated through 2021, with a return to historical growth rates most likely in Q2 2022.”
If carriers had to watch one thing, what should it be?
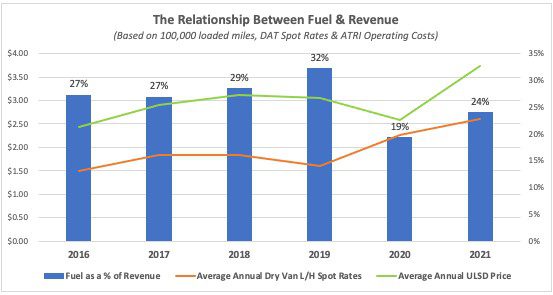
In 2019, a startling high 1,100 trucking companies went out of business, including very large carriers such as Celadon, New England Motor Freight and Falcon Transport. During that year, fuel costs as a percentage of revenue peaked at 32% with average annual line haul rates at $1.60/mile (excluding fuel) and diesel averaging $3.06/gal. Therein lies a critical number for carriers to monitor.
Right before the pandemic hit, fuel costs as a percentage of revenue decreased to 29% but was still a long way from the long-term profitability target of 25%. When freight volumes crashed in April of 2020 as widespread economic disruption forced more than 3,000 trucking companies into bankruptcy and pushed millions into unemployment, diesel prices also plummeted, driving fuel as a percentage of revenue to an average of just 19% last year.
This helps explain the record profits carriers have been reporting in the last year but also offers a cautionary warning. Fuel as a percentage of revenue (based on a truck running 100,000 loaded miles per year plus 10,000 mile deadhead and ATRI operating costs) is currently averaging 24% as we end 2021. It’s getting close to where owner-operators need to be (25%) to maintain long-term profitability and still draw a salary of $50,000 per year.
It’s not so much about the rate per mile or the cost of diesel. But ICs and small fleets should monitor the relationship between the two closely. Of course, fuel costs aren’t the only line item to watch, but it is typically one of the biggest cost items in running a trucking business.
The message is that the long-haul freight market will turn eventually. Those that have a good handle on their operating costs, solid business partners, and the most accurate rate forecasting tools will be in good shape no matter what happens in 2022.


