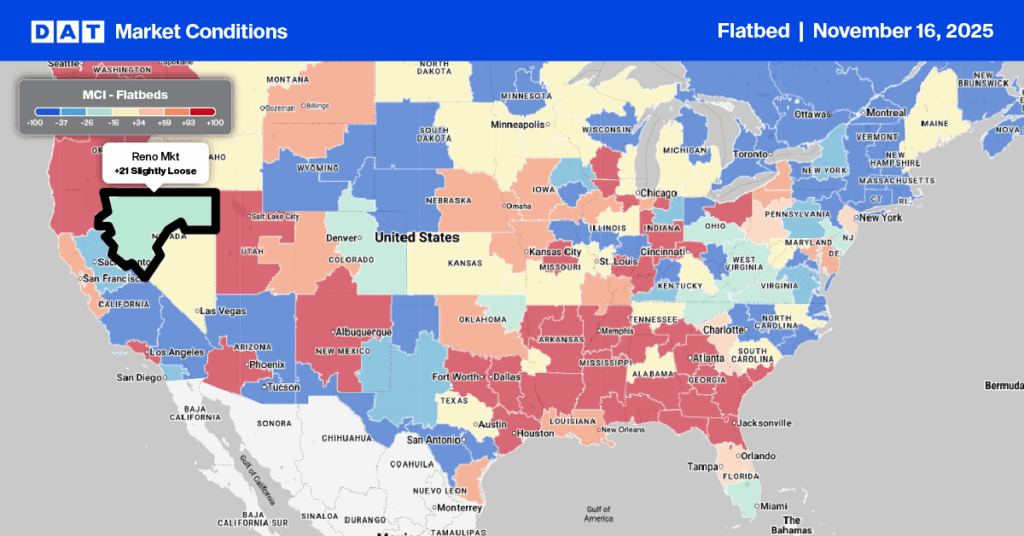
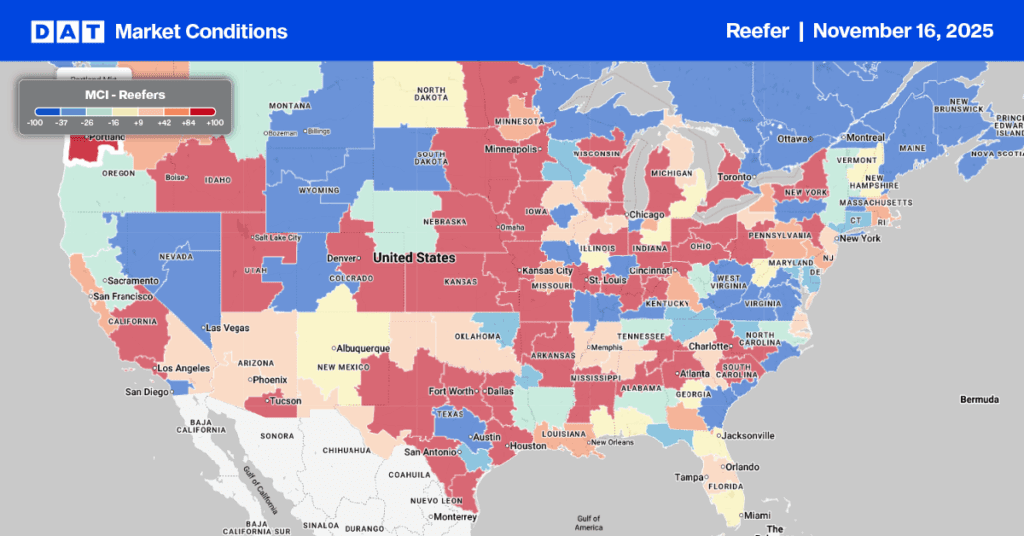
Winter storms wreaked havoc on freight markets last week. Add to that the lack of snow removal and road-treating equipment in states not used to cold air, snow and ice – as well as moist Gulf air being dragged into the storms as they moved east – and the result was snow-covered interstates, highway closures, out-of-service truck stops, trees down and millions without power.
The impact on spot markets was significant, with dry van spot rates surging for the second week in succession, increasing by $0.19/mile from $2.05/mile, excluding fuel surcharges, to $2.24/mile. Gains were slightly higher in the temperature-controlled sector, where demand for reefers was high to keep traditional dry freight from freezing. Last week reefer, spot rates jumped $0.22/mile from $2.32/mile, excluding fuel, to $2.55/mile.
While the recent Polar Vortex events have many thinking back to the winter of 2014, Winter Storms Uri and Viola took a different path last week, resulting in a very different impact on freight markets.
Get the clearest, most accurate view of the truckload marketplace with data from DAT iQ.
Tune into DAT iQ Live, live on YouTube or LinkedIn, 10am ET every Tuesday.
“The main difference between the 2014 and 2021 Polar Vortex events is the location and duration,” according to meteorologist Michael Page from FlawlessForecaster. “The big cold snap associated with the Polar Vortex breaking free in 2014 was a little more displaced towards the East Coast whereas last week’s displacement of the Polar Vortex is much more focused in the middle of the country and farther south; 2014 also lasted a lot longer with a series of storms dumping cold air, snow and ice over a four-month period.”
From a freight market perspective, the 2014 Polar Vortex resulted in a 14% increase in dry van spot rates increasing in the first 100 calendar days. Dry van spot rates didn’t really start taking off until the end of January 2014 following the first major storm in week one, a Nor’easter in week three and then the deadly Atlantic Winter Storm in week four, stranding motorists and truckers along Interstates 75 and 85 due to treacherous driving conditions. More winter storms in the Midwest throughout February created blizzard conditions immobilizing trucks and trains in the process.
Most of the 14% rate increase due to the 2014 Polar Vortex came in February when spot rates increased by 13 cents per mile and stayed there until the second week of April. The impact on reefer rates over the same timeframe was similar – also increasing by 14% over the first 100 days.
By contrast, last week’s similar rate increase occurred in just seven days.
Interestingly, the spike in rates during the 2014 weather event was only $0.02/mile lower than the peak in spot rates ($1.50/mile, excluding fuel) during the produce shipping season that year – typically a major high point in spot rates each year.
This time the Polar Vortex extended all the way from the Canadian to the Mexican border, trapping a large part of the middle of the country in record low temperatures and crippling some of the busiest interstate highways. According to data from the National Operational Hydrologic Remote Sensing Center, snow covered 71% of the U.S. to an average of 6.2 inches last week. Compared to the same week last year, only 33% of the U.S. was covered in snow to a depth of 4.7 inches.


