June provided some much-needed recovery for truckload markets, but as COVID-19 outbreaks grow exponentially in major freight markets, including California, Texas, Arizona and Florida, the potential for volatility cannot be underestimated.
But even as those states roll back their reopening plans, others like New York are now into their third phase of reopening. The state of New York, which has a GDP comparable to Canada and South Korea and is the third-largest economy in the United States, could be our best case study for how freight markets will recover post-Fourth of July.
Phase one began in New York on May 15, which included agriculture, construction and manufacturing businesses, provided that each region met prescribed health metrics. Around the same time New York, ramped up COVID-19 testing. Over the same timeframe, positive test rates declined, making June the first full month where the state’s main manufacturing freight markets were fully active.
Brooklyn, Buffalo, Rochester, Syracuse, Elmira and Albany saw a combined 26% increase in outbound dry van volumes, month over month. Most of this volume comes from the Syracuse, Rochester and Buffalo markets, which combined recorded a 51.4% increase.
In their Empire State Manufacturing Survey for June, The Federal Reserve Bank of New York reported that their general business conditions index climbed nearly 50 points from unprecedented lows in April and May. The report showed that New York manufacturing firms were also much more optimistic in June, with the index for future business conditions rising 27 points to its highest level in more than a decade.
If the post-July 4 COVID-19 numbers for the state hold steady, freight markets in New York might offer a look at what the longer term recovery for freight markets will look like.
Dry van trends
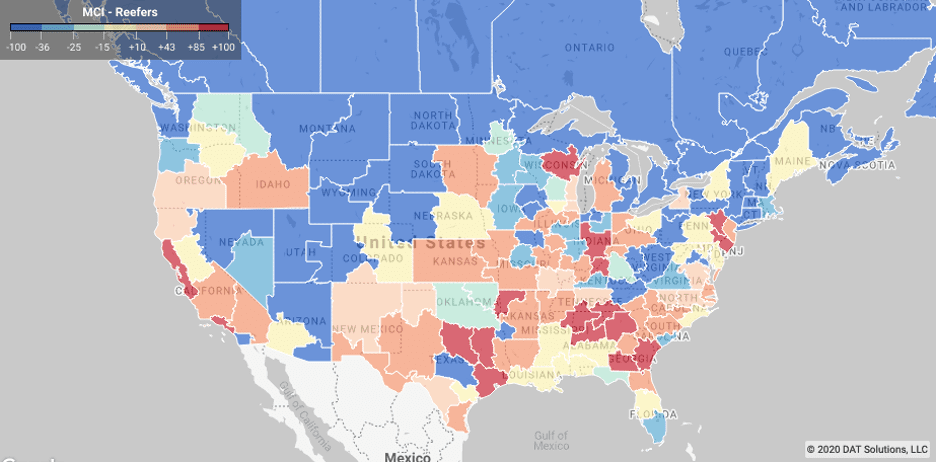
Market Condition Index (MCI)
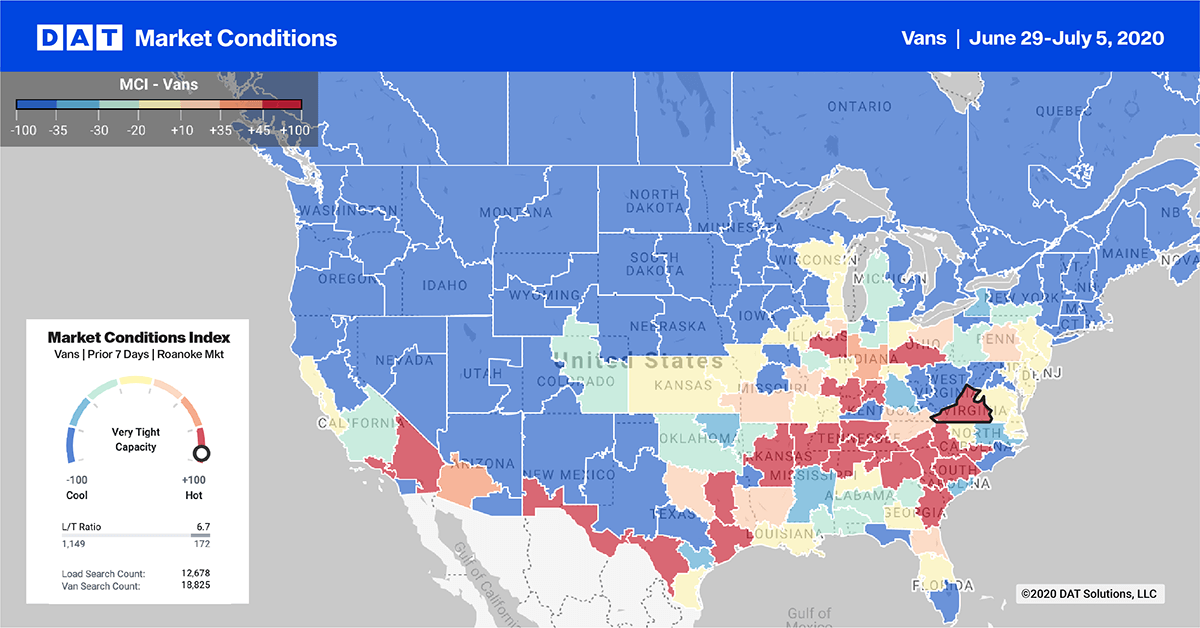
As the Market Conditions Index shows above, freight markets that have been the most aggressive with their economic reopening schedules continue to show elevated levels of activity.
Importers also boosted demand for dry vans, with retail freight staged in warehouse markets in readiness for what’s expected to be an $80 billion back-to-school shopping season, according to the National Retail Federation, which runs through the end of August.
On the domestic front, the majority of southern freight markets saw tighter capacity, which put upward pressure on spot rates. Markets in red in the Southeast, Southwest and West Coast indicate capacity was tight before the July 4 break. Last week also included a higher level of activity along the U.S.-Mexico border, with Geotab reporting a 2% increase in daily bidirectional trips across the border compared to pre-COVID-19 levels.
> Learn more about the Market Conditions Index
Load-to-truck ratio
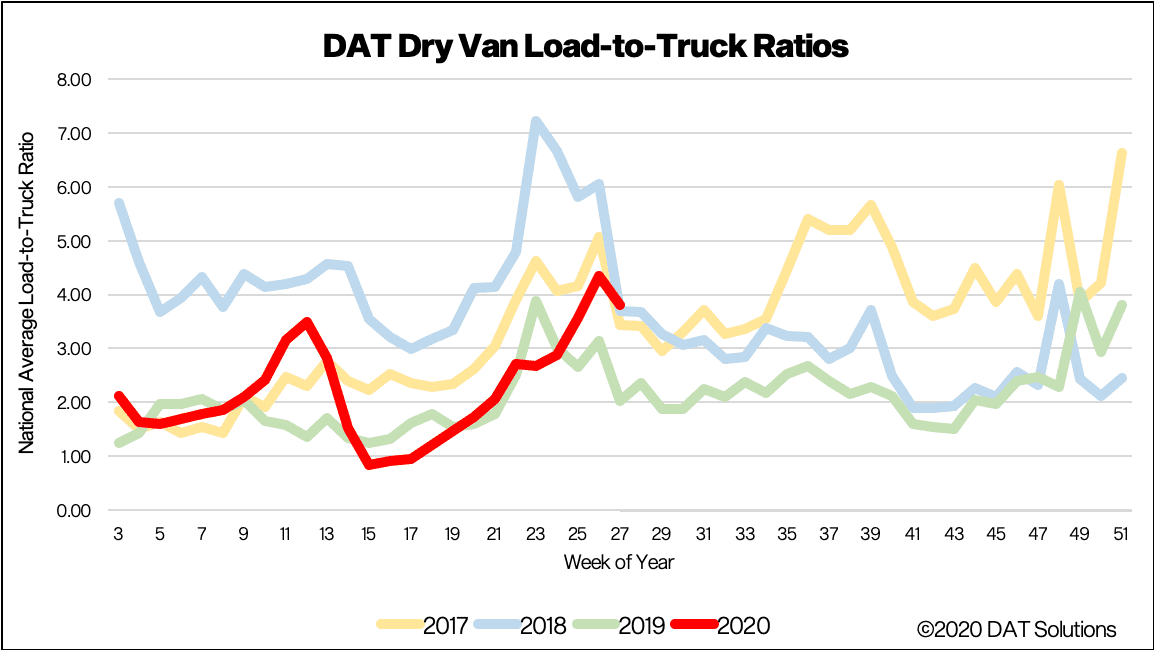
Following the mid-week / end-of-month shipping peak just before the July 4 break, the load-to-truck ratio (LTR) on the DAT One network predictably decreased by 12% last week to 3.8. Truck searches dropped for the fourth straight week, decreasing by 9% week over week and 3% year over year, as carriers took time off over the break. Compared to the February 2020 baseline period, Geotab reported daily commercial truck trips in the U.S. were down 3% at the end of June for all equipment types but not far off pre-COVID-19 daily trip levels.
> Learn more about the DAT One load board network
Spot rates
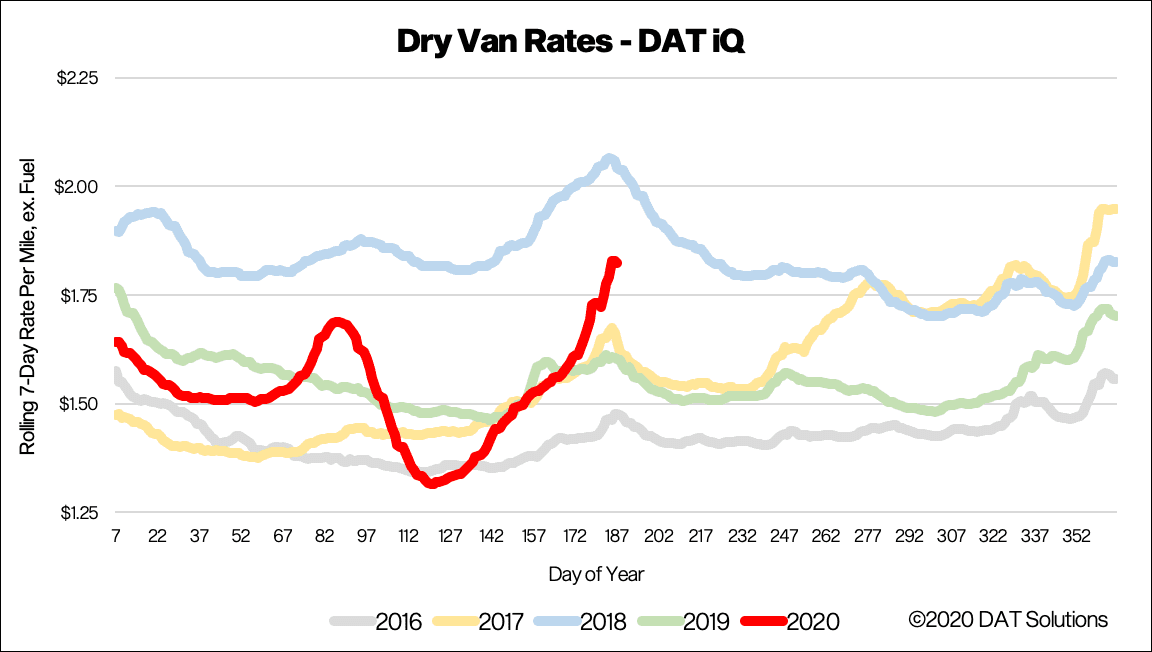
Dry van spot rates surged last week to $1.82/mile, excluding fuel surcharges, which is around 12 cents higher than the same period in 2017 and 2019. Rates increased 5% w/w, as freight volumes continued to increase through the end of June in readiness for Independence Day celebrations.
Shippers also anticipated higher consumer demand based on strong numbers in May, as restaurants and retail stores reopened. Of course, that was before COVID-19 levels began to increase sharply at the start of June, so there is some concern that demand could drop off sharply if positive tests continue at the same pace.
Our Ratecast predictive model expects July 5 to have been the peak for the national dry van rate, which will drop back to around $1.73/mile by the time we get to the first week of August.
> Learn more about freight rate tools from DAT iQ
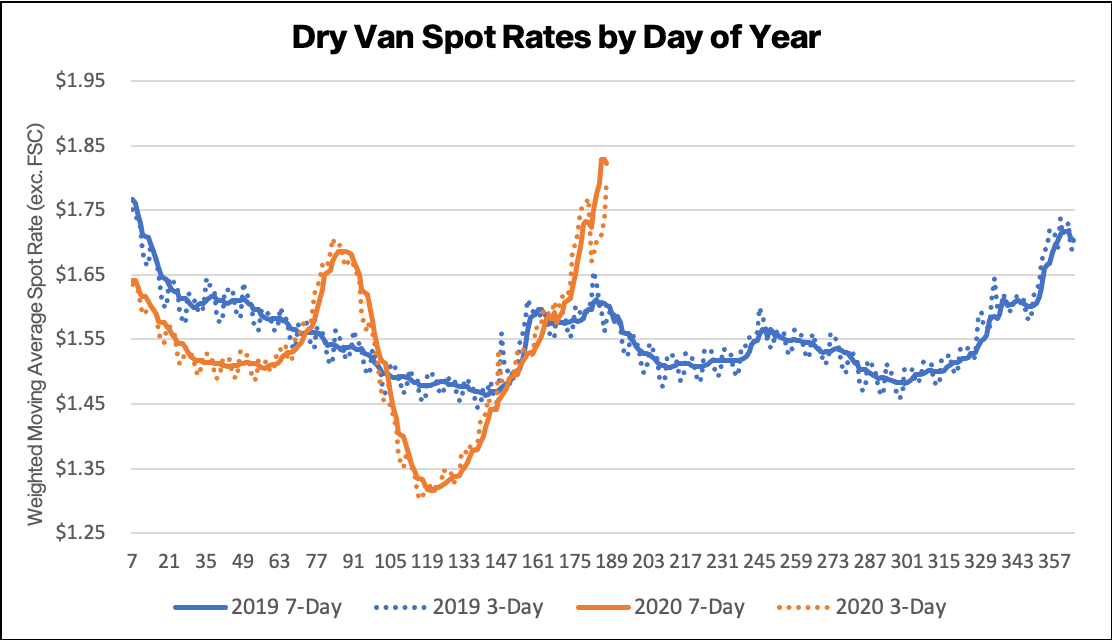
The graphs above shows 3-day and 7-day rolling, weighted averages of spot truckload rates, updated daily, and illustrated by year. The average helps to smooth out day-of-week effects, but it is plotted daily to show how things are changing in the extreme near term.
DAT does not typically publish rates in this format, and as such, they will not match other figures that customers may be familiar with in our blog or other content. We are making these available to the public to help demonstrate the rapidity of changes occurring in the spot market.
> Learn more about custom reporting available from DAT iQ
Spot rate forecasts
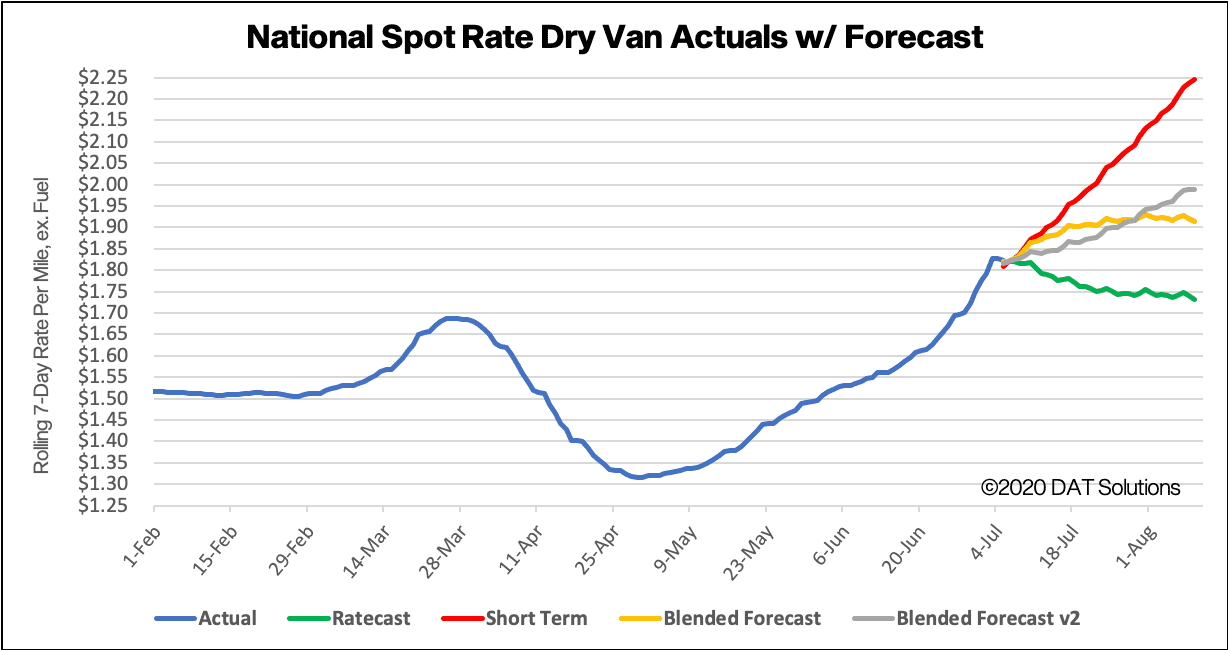
Forecasting during this volatile period is difficult. Our team is working diligently to update and adjust the models, but new information becomes available at a rapid pace. DAT would typically not publish these types of preliminary studies, but we feel that the benefit of sharing our observations far outweighs the risk. We ask that you please treat these statements and exhibits as directional and consider them as a variable in your own analyses.
How to interpret the rate forecast
- Ratecast Prediction: DAT’s core forecasting model
- Short Term Scenario: Formerly the pessimistic model that focuses on a more near-term historical dataset.
- Blended Scenario: More heavily weighted towards the longer-term models.
- Blended Scenario v2: More heavily weighted towards the shorter-term models.
> Learn more about rate forecasts from DAT iQ
Reefer trends
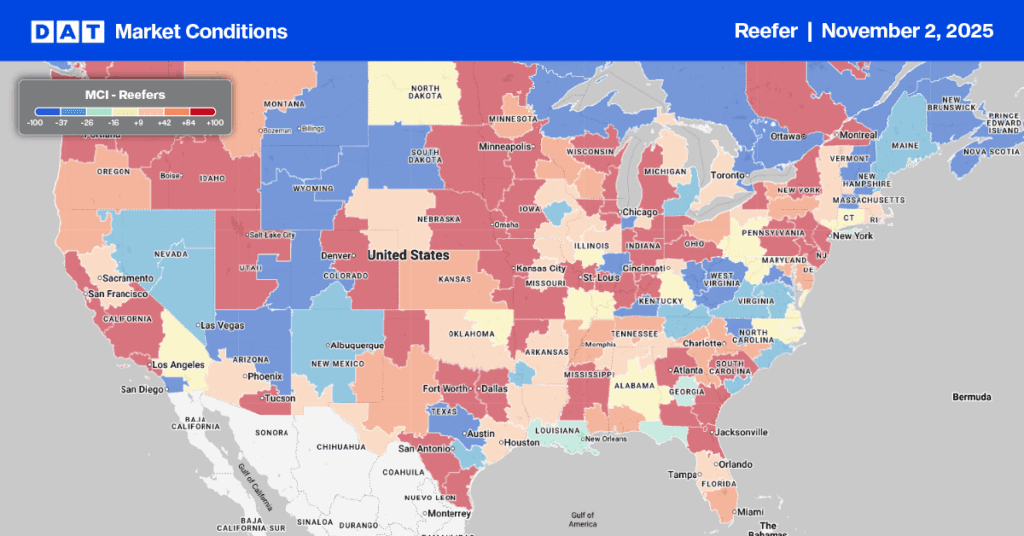
Market Conditions Index (MCI)
The USDA reported that seasonal truckloads of produce were down 17% last week due to a downturn in imports. Domestic shipments were up around 2% w/w – that’s around 600 additional loads over the prior week. Produce volumes from Mexico typically tail off quickly this time of year and are now down 27% w/w.
Data from the USDA shows strong consumer demand for sweet potatoes in North Carolina (where about two-thirds of U.S. sweet potato production is located). A 54% increase in reefer loads last week was met with a shortage in capacity, which pushed spot rates out of the state up 23%.
On the West Coast, all produce markets reported tight capacity. May and June are peak months for California strawberries in the Watsonville-Salinas regions of the San Francisco (SFO) market. SFO refrigerated load volumes averaged around 12,000/week, with most heading to Seattle – rates to all Pacific Northwest markets reported the highest w/w increases. SFO outbound rates increased 8% w/w. Regional moves to Ontario, CA; Los Angeles and Fresno were the highest at $3.01, $3.05 and $4.04 per mile respectively.
There are still good volumes of potatoes being shipped. The USDA reports around 1,800 truckloads per week coming out of the Twin Falls (TWF) market in Idaho, which accounts for around 38% of total domestic supply. Reefer rates out of TWF are up 4% w/w to $1.81/mile and close to 6% m/m, with weekly loads averaging 7,500 in June.
> Learn more about the Market Conditions Index
Load to truck ratio (LTR)
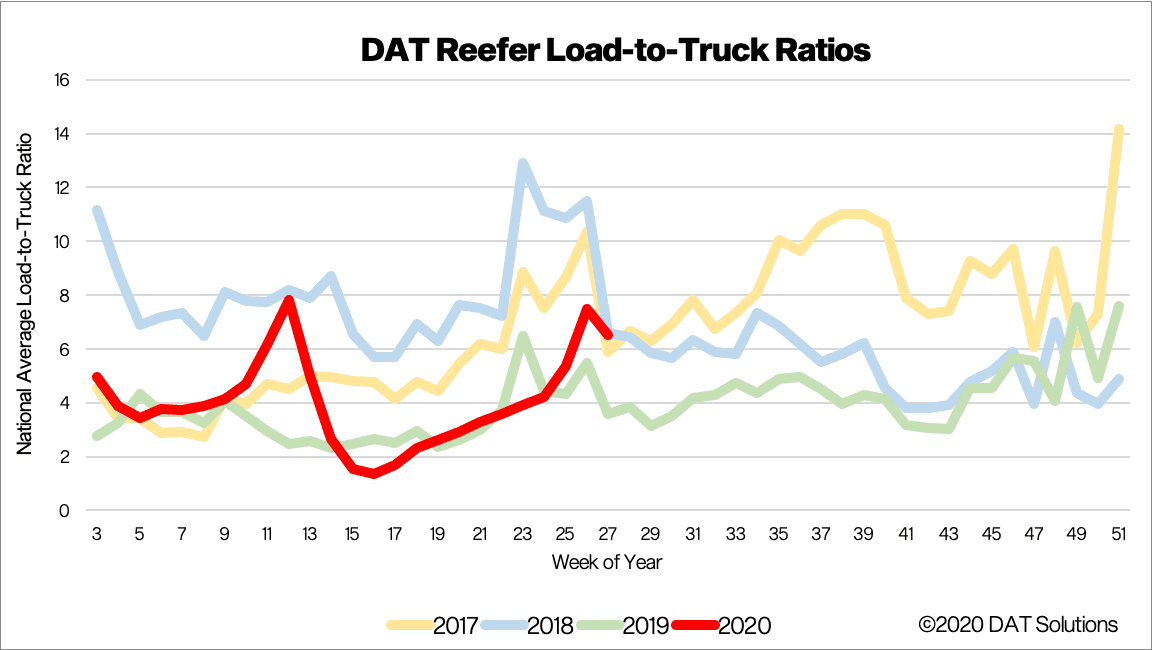
The reefer LTR dropped 13% to 6.5 last week, following the surge in refrigerated volumes to meet demand for July 4 celebrations. DAT estimated around 52,000 truckloads of beer, chicken and hot dogs were shipped last week in addition to normal seasonal volumes. The reefer LTR is also up 45% y/y, which is around 2017 and 2018 years – both considered some freight markets for reefer carriers.
> Learn more about the DAT One load board network
Spot rates
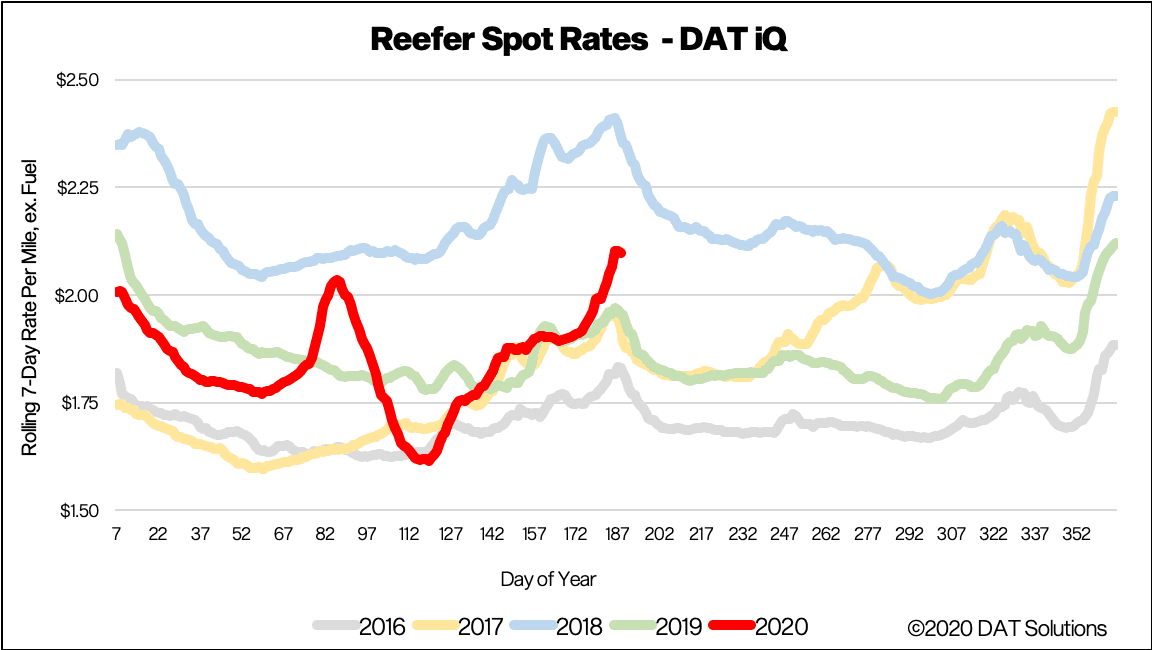
National average reefer rates increased by 5% w/w to $2.10/mile, excluding FSC and up 7% y/y. With the exception of the capacity-constrained 2018 freight market, rates last week were the highest pre-July 4 rates we’ve seen since 2015. Even in 2018 we didn’t see a w/w rate increase close to the 11 cent increase observed last week.
Our Ratecast model expects the national reefer rates peak to be July 7 at $2.08/mile and then drop back to around $1.97/mile by the time we move into the first week of August.
> Learn more about freight rate tools from DAT iQ
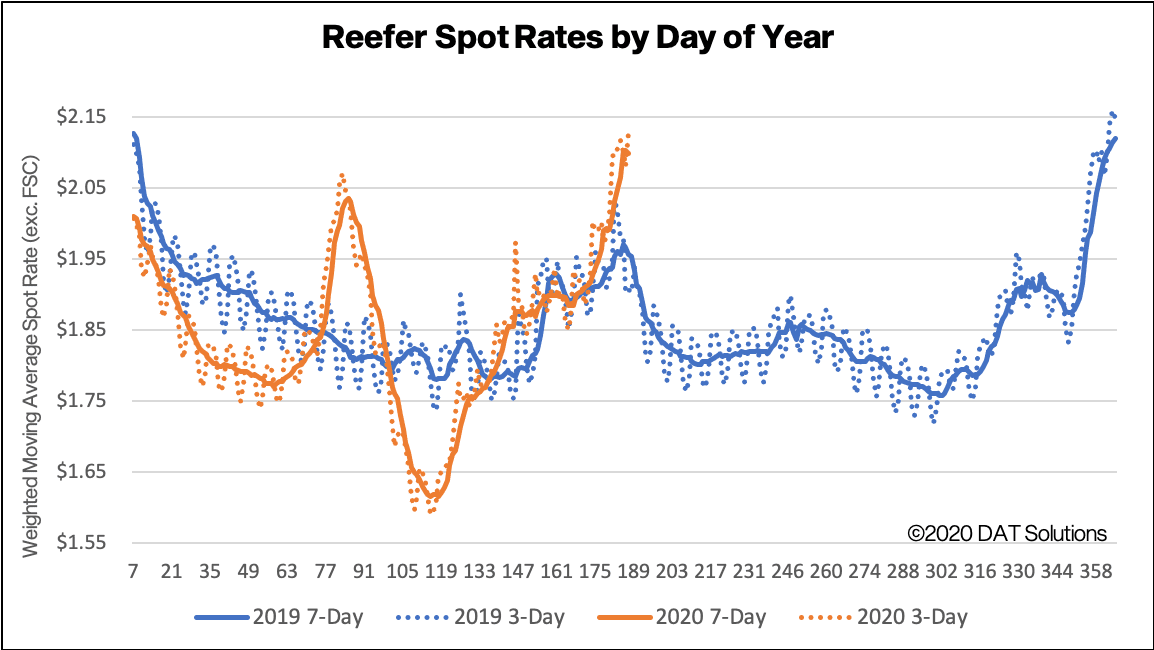
The graphs above shows 3-day and 7-day rolling, weighted averages of spot truckload rates, updated daily, and illustrated by year. The average helps to smooth out day-of-week effects, but it is plotted daily to show how things are changing in the extreme near term.
DAT does not typically publish rates in this format, and as such, they will not match other figures that customers may be familiar with in our blog or other content. We are making these available to the public to help demonstrate the rapidity of changes occurring in the spot market.
> Learn more about custom reporting available from DAT iQ
Spot rate forecasts
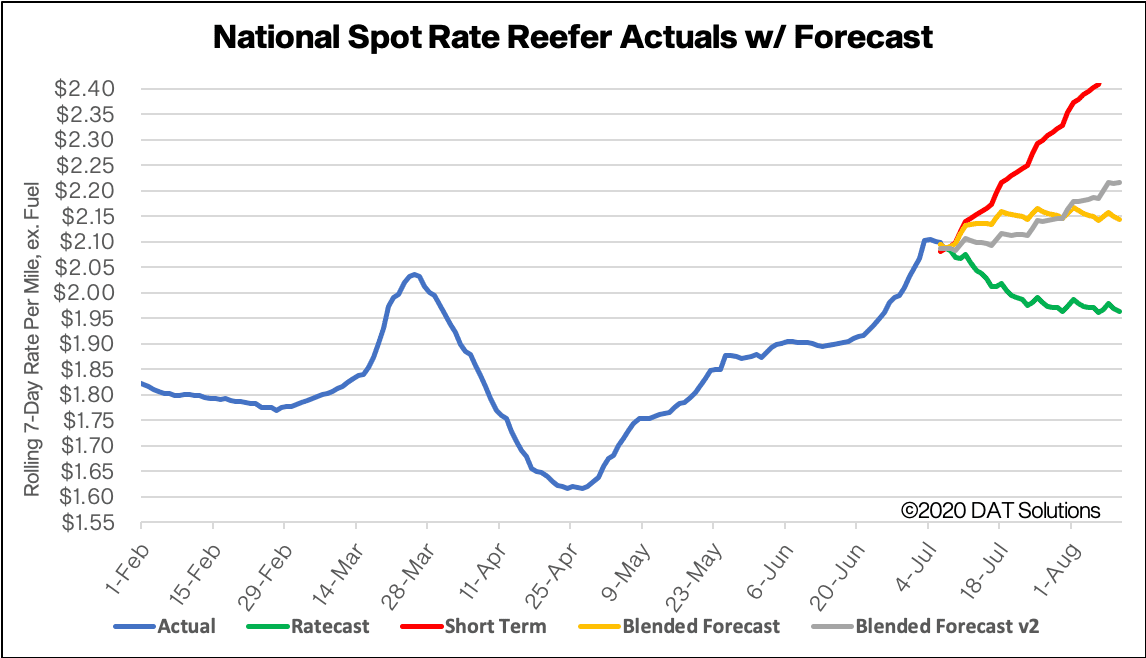
How to interpret the rate forecast
- Ratecast Prediction: DAT’s core forecasting model
- Short Term Scenario: Formerly the pessimistic model that focuses on a more near-term historical dataset.
- Blended Scenario: More heavily weighted towards the longer-term models.
- Blended Scenario v2: More heavily weighted towards the shorter-term models.
> Learn more about rate forecasts from DAT iQ
Flatbed trends
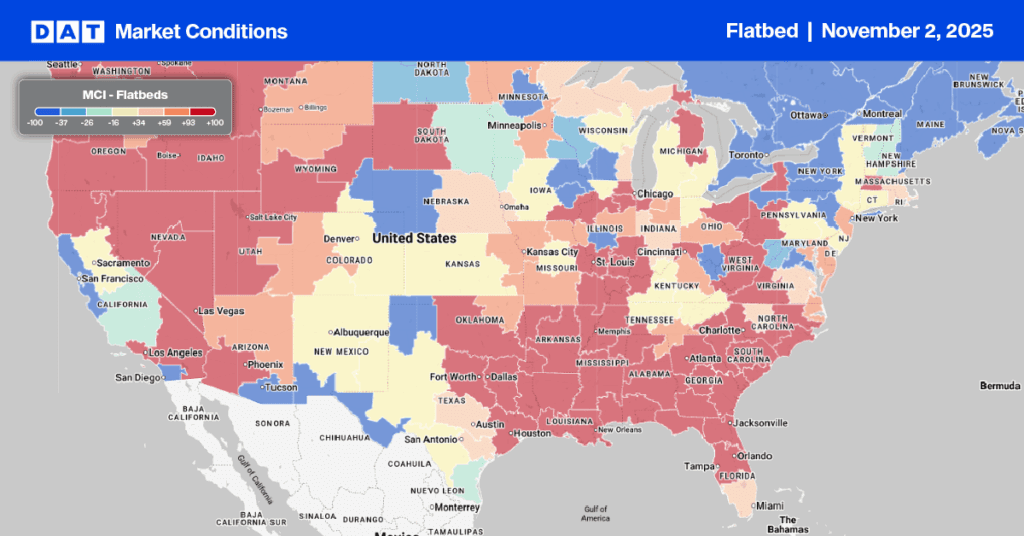
Market Conditions Index (MCI)
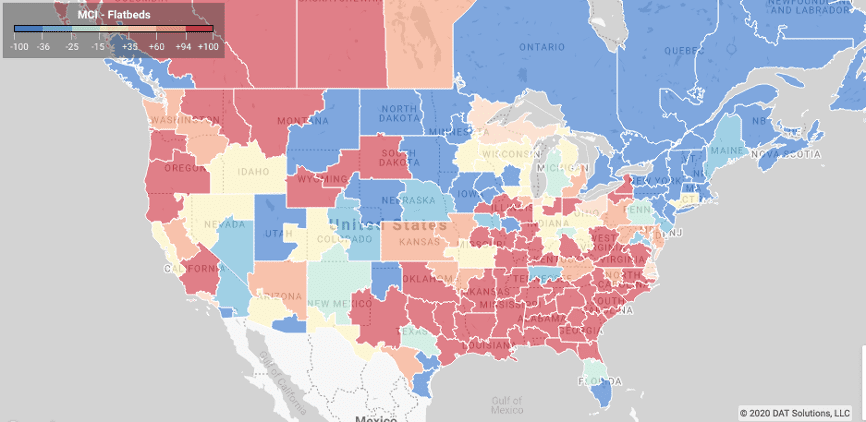
The Institute of Supply Management (ISM) reported that the June PMI grew to 52.6%, which was up 9.5% from the May. This represents a second straight expansion of the economy, according to ISM (values over 50 represent expansion and values below 50 represent contraction). For flatbed carriers the news was even better, as new orders jumped 25% to reach 56.4%, which also points to manufacturing entering an expansion cycle.
Single-family housing starts were up 4.3% in May, with carryover of volume into June. Carriers delivered freight into key markets, including those in the Southeast where around 50% of new home starts are recorded. Another reliable indicator of flatbed demand is building permits, which were up 14% in May after hitting a five-year low in April. Permits for the freight-intensive single-family home were also up 12% in May.
In Texas, flatbed volumes from Fort Worth and Lubbock were up 22% and 6% respectively w/w. Load posts per week almost doubled from the first week in June to the end of June, from 21,101 to 38,385 per week.
> Learn more about the Market Conditions Index
Load-to-truck ratio (LTR)
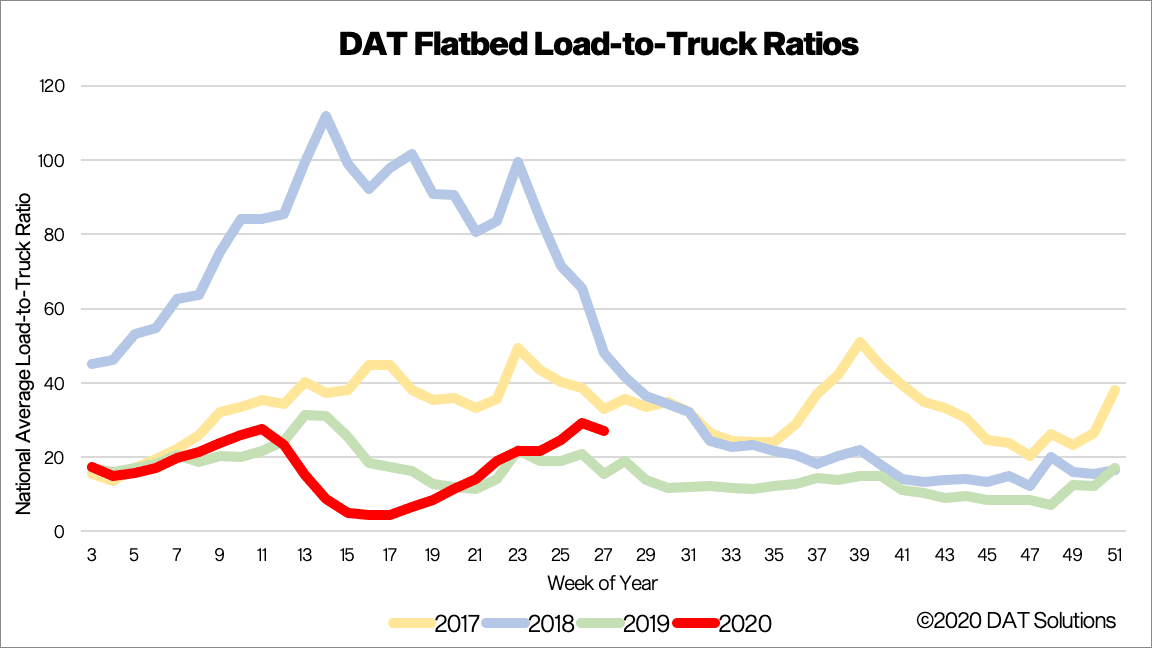
Flatbed load posts decreased by 19% w/w due to the holiday weekend, contributing to the flatbed LTR dropping by 8% w/w.
> Learn more about the DAT One load board network
Spot rates
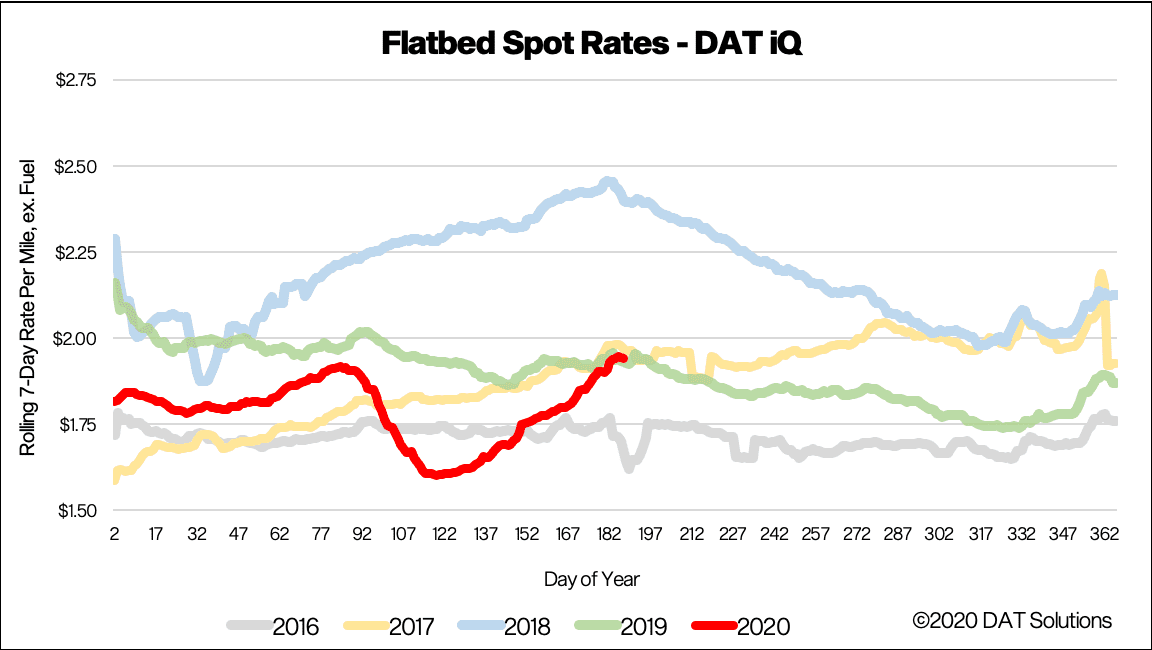
Strong demand for flatbeds pushed the national average spot rate up 4 cents to $1.94/mile, excluding FSC, tracking closely with 2017 and 2019 prices. The Fort Worth and Lubbock markets reported tight capacity, with the largest w/w rate increases of 4% and 2% respectively. The average rate on 58 origin-destination pairings increased from $1.90 to $2.09/mile, with shorter, regional moves to Shreveport, LA, and Little Rock, AR, paying $3.23 and $2.94/mile respectively.
Our Ratecast model expects flatbed rates to have peak on July 6 and drop back to around $1.89/mile by the time we move into the first week of August.
> Learn more about freight rate tools from DAT iQ
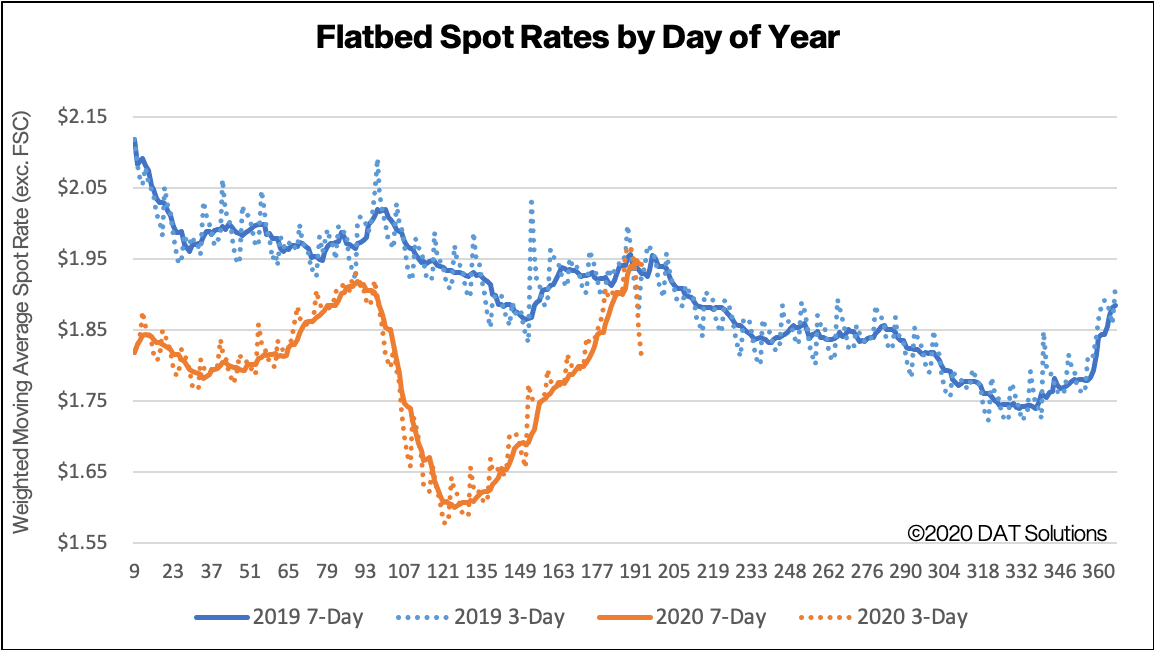
The graphs above shows 3-day and 7-day rolling, weighted averages of spot truckload rates, updated daily, and illustrated by year. The average helps to smooth out day-of-week effects, but it is plotted daily to show how things are changing in the extreme near term.
DAT does not typically publish rates in this format, and as such, they will not match other figures that customers may be familiar with in our blog or other content. We are making these available to the public to help demonstrate the rapidity of changes occurring in the spot market.
> Learn more about custom reporting available from DAT iQ
Spot rate forecasts
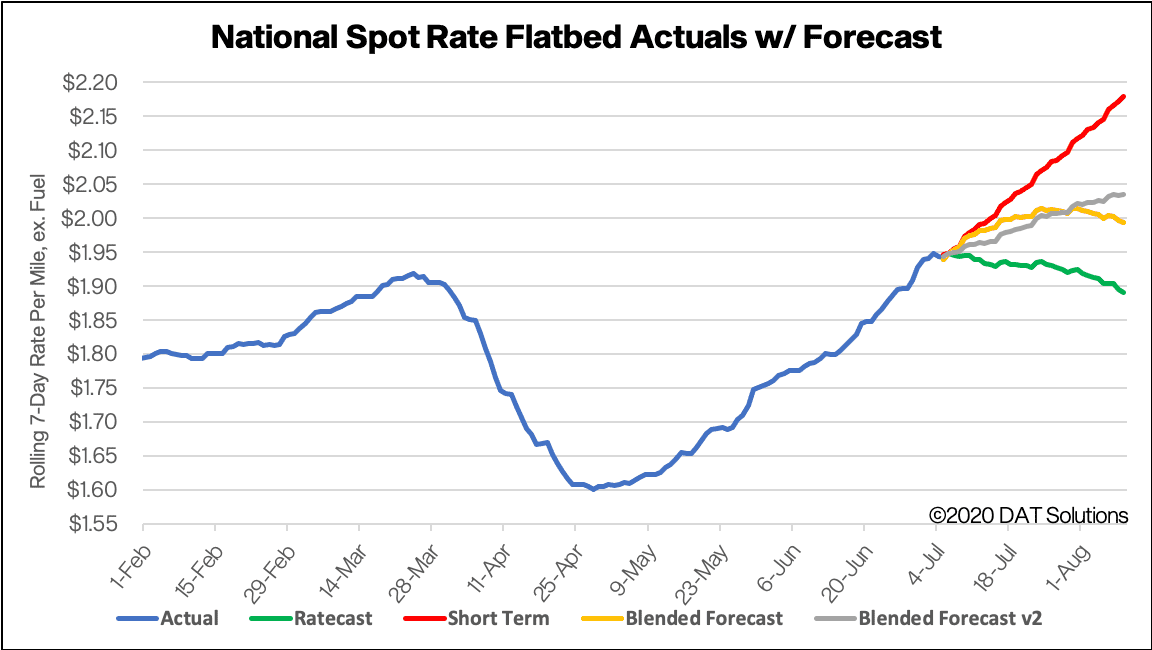
How to interpret the rate forecast
- Ratecast Prediction: DAT’s core forecasting model
- Short Term Scenario: Formerly the pessimistic model that focuses on a more near-term historical dataset.
- Blended Scenario: More heavily weighted towards the longer-term models.
- Blended Scenario v2: More heavily weighted towards the shorter-term models.
> Learn more about rate forecasts from DAT iQ
Need more information…
Our update will be refreshed next week, or sooner if conditions change materially. Any questions on this report or market conditions can be emailed to askIQ@dat.com.
We are also making available, free of charge, the DAT Daily 50 which is a daily report of the top 50 lanes by volume with a week’s worth of history and predictions using the Ratecast model.