The third week of July is normally the busiest for summer vacationers, and seasonal retailers rely on them. But with travel restrictions on some international and interstate travel, some businesses that depend on tourism during the short summer retail season are seeing revenues down as much as 90%, year over year. This means a lot less retail freight along with fewer truckloads of food and beverages.
The freight economy recovery also remains uneven, as some regions are forced to slow down reopening plans and consider more lockdowns. Others are seeing more economic activity return, like New York, Massachusetts and Connecticut. From a freight volume perspective, New York in particular is worth watching.
Since June 20, the state’s rate of positive COVID-19 tests has been stable at 1.8% (as of July 15). In contrast, the Midwest, South and West regions have escalating rates of 5.1%, 13.4% and 9.2% respectively.
To gauge the impact on trucking and freight flows, time and attendance software company Homebase has some interesting industry productivity data. The number of employees working and the total hours worked in New York City increased around 8% in the last two weeks of June, as the state moved into Phase 3 of reopening. In cities like Houston and Phoenix, where virus outbreaks surged over the same timeframe, employees working and hours worked decreased by around 5%.
This is by no means a definitive measure of the impact on the freight market, but it does echo what we’re hearing on the road and seeing in our data. The result is that contract and spot prices have not moved in sync as they normally do. Spot rates have risen faster since May and are now close to contract rates for all equipment types this week. This is a direct result of the ongoing COVID-19 pandemic, which points to more inconsistent freight volumes and unbalanced carrier networks in the short-term, as shippers send more loads to the spot market to meet erratic demand and carriers increasingly become more selective about what contract loads they haul.
Dry van trends
Market Condition Index (MCI)
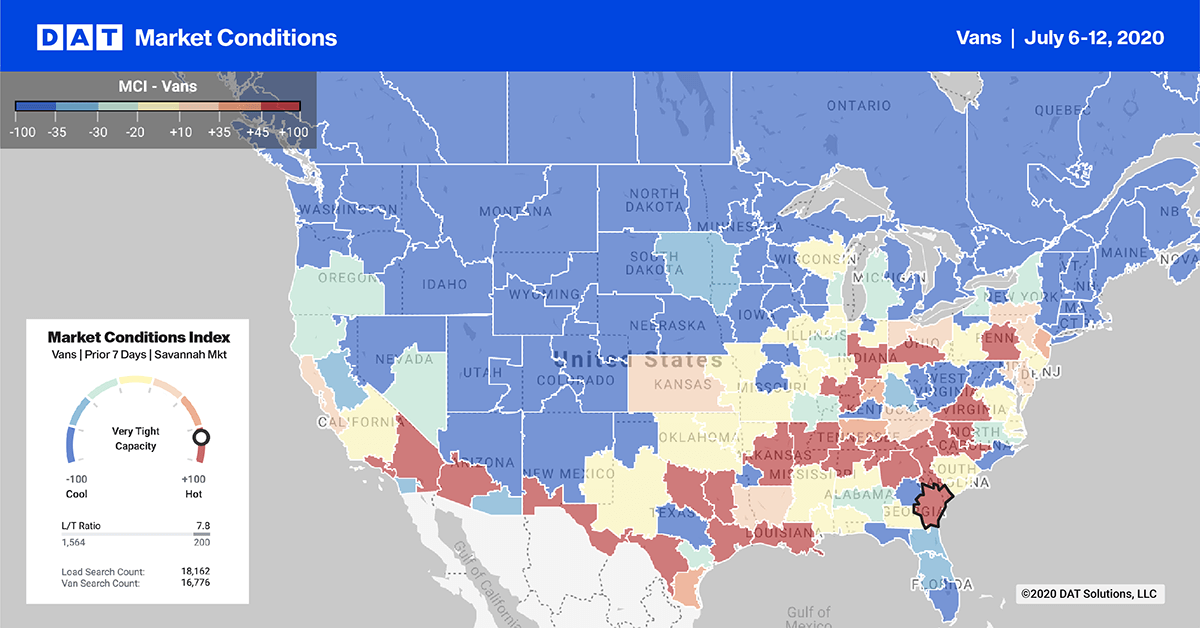
Major outbound freight markets in the Northeast lead the way on the East Coast. Load volumes out of Harrisburg, PA, are up 27% week over week and 60% month over month, with 22% of loads destined for Hartford, CT; Elizabeth, NY; Boston and Albany, NY, markets – all within a 400-mile radius. Harrisburg dry van rates were also up 1.2% w/w and are now up 17% over the last three weeks.
=On the West Coast, Los Angeles and Ontario markets recorded a 19% drop in load posts from the peak on June 27 and are now back to seasonal levels. Rates are also down 1.74% w/w – a drop of 5 cents from the high point of $2.47/mile on July 5, excluding fuel. Just over 15% of loads last week were destined for the major warehouse markets of Stockton, CA, and Phoenix, which is consistent with the staging of imports for back-to-school retail season.
> Learn more about the Market Conditions Index
Load-to-truck ratio
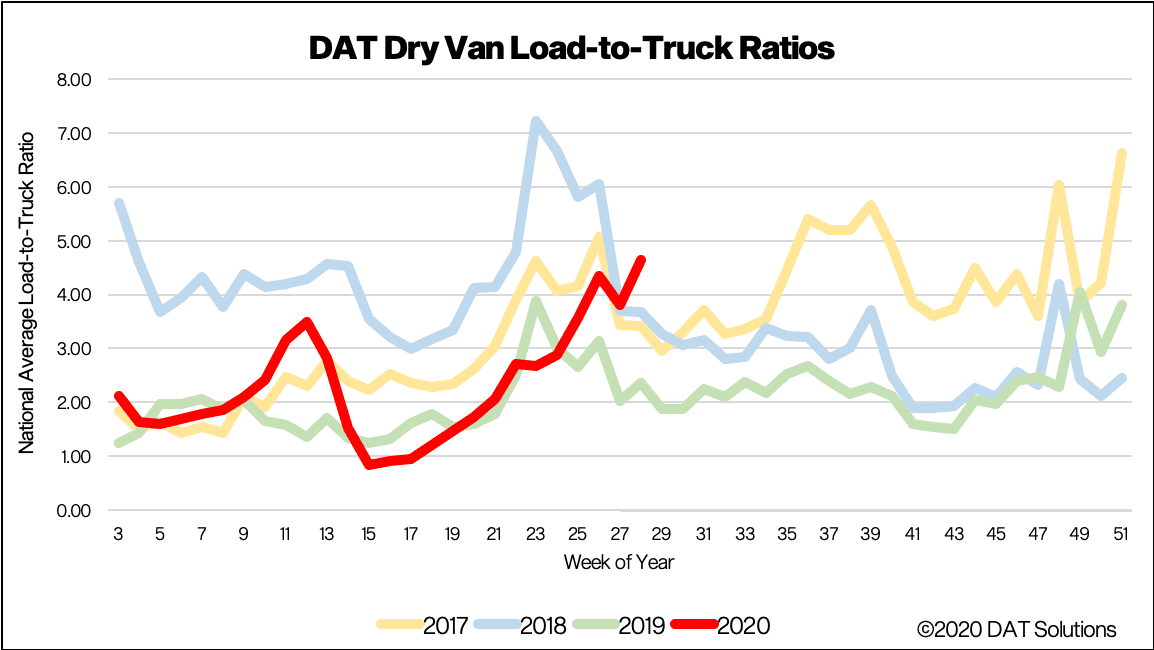
Last week’s load-to-truck ratio (LTR) bounced back to pre-July 4 levels, increasing by 22% w/w to 4.65. Carriers returned to the market last week, with truck posts up 4% w/w but down 12% y/y, suggesting capacity is tighter than the same time last year.
Compared to the February 2020 baseline period, Geotab reported daily commercial truck trips in the U.S. last week were down 10%, 11% in Canada and 6% in Mexico. The last time U.S. truck trips were at this level was May 18, with June 25 marking the only time capacity has been at or near pre-COVID-19 levels. Since then there has been a noticeable downward trend in daily trips.
Dry van capacity typically loosens from now through to early October as more trucks search for loads and post their availability.
> Learn more about the DAT One load board network
Spot rates
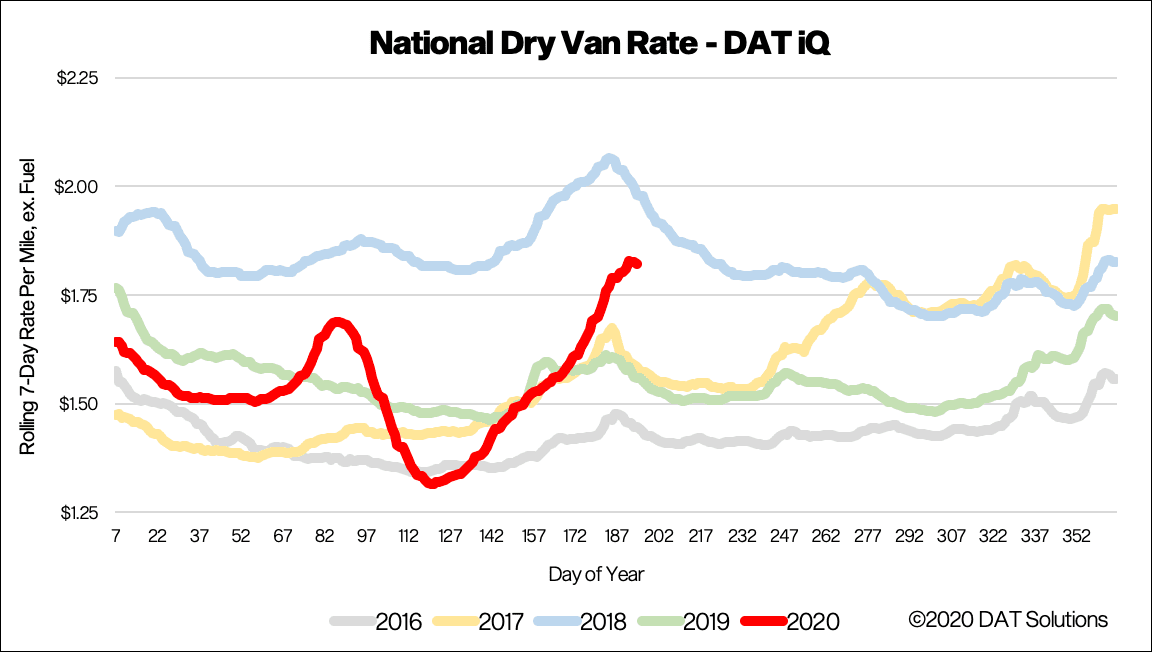
The national average dry van spot rate continued to climb last week, hitting $1.82/mile, excluding FSC, which is 26 cents higher than the same time last year. However, there are signs that dry van rates may have peaked and could drop back, as demand decreases across the board along with the re-closures in California and scaling back of reopening plans in Texas, Florida and Arizona.
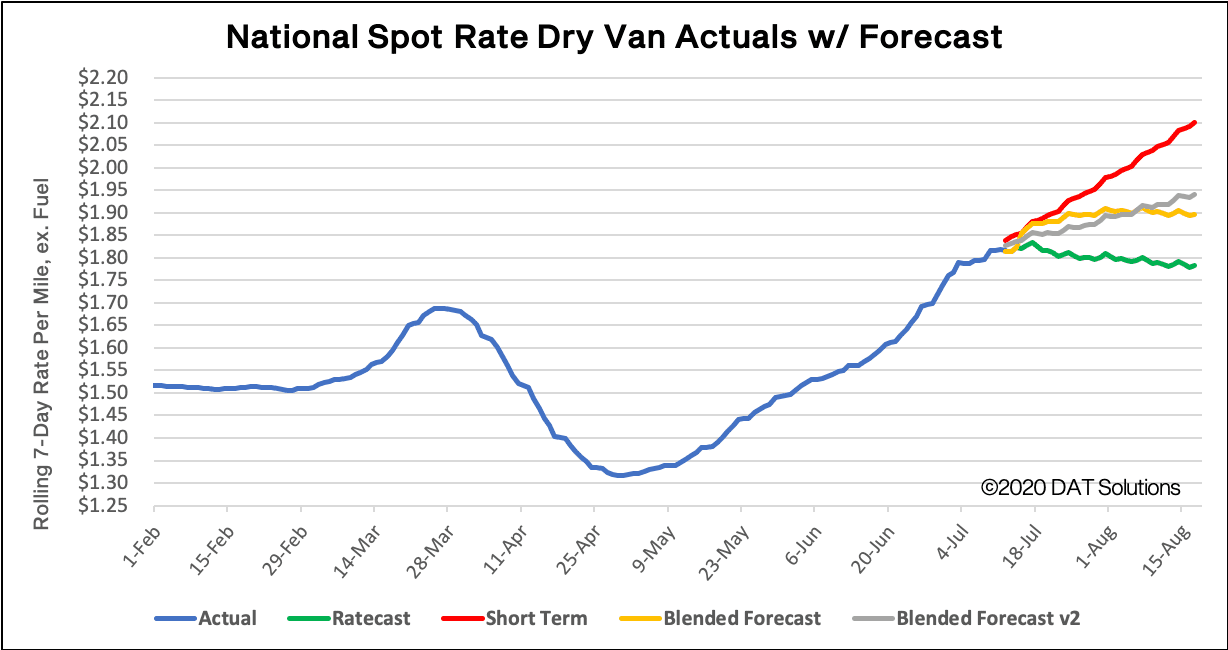
After declining steadily since the start of 2019, contract rates appear to have bottomed and now hovering around $2.09/mile, and although this is 5% lower y/y, they have increased 1.3 cents since mid-May. Our Ratecast model expects dry van rates to drop back to around $1.78/mile mid-August.
> Learn more about freight rate tools from DAT iQ
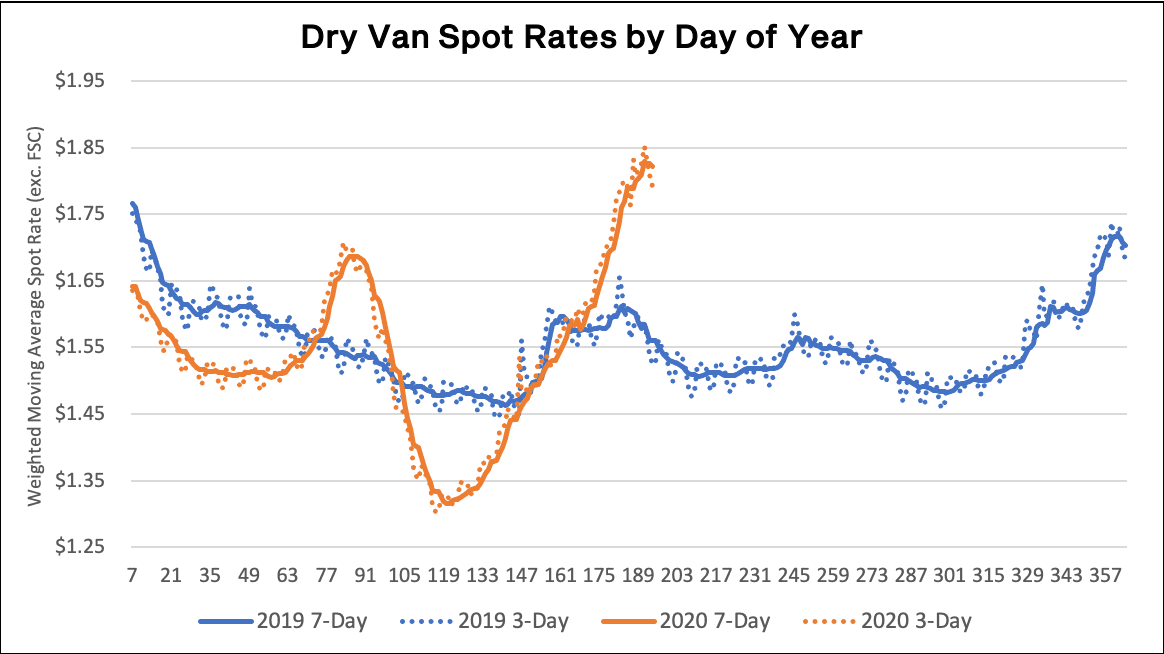
The graphs above shows 3-day and 7-day rolling, weighted averages of spot truckload rates, updated daily, and illustrated by year. The average helps to smooth out day-of-week effects, but it is plotted daily to show how things are changing in the extreme near term.
DAT does not typically publish rates in this format, and as such, they will not match other figures that customers may be familiar with in our blog or other content. We are making these available to the public to help demonstrate the rapidity of changes occurring in the spot market.
> Learn more about custom reporting available from DAT iQ
Spot rate forecasts
Forecasting during this volatile period is difficult. Our team is working diligently to update and adjust the models, but new information becomes available at a rapid pace. DAT would typically not publish these types of preliminary studies, but we feel that the benefit of sharing our observations far outweighs the risk. We ask that you please treat these statements and exhibits as directional and consider them as a variable in your own analyses.
How to interpret the rate forecast
- Ratecast Prediction: DAT’s core forecasting model
- Short Term Scenario: Formerly the pessimistic model that focuses on a more near-term historical dataset.
- Blended Scenario: More heavily weighted towards the longer-term models.
- Blended Scenario v2: More heavily weighted towards the shorter-term models.
> Learn more about rate forecasts from DAT iQ
Reefer trends
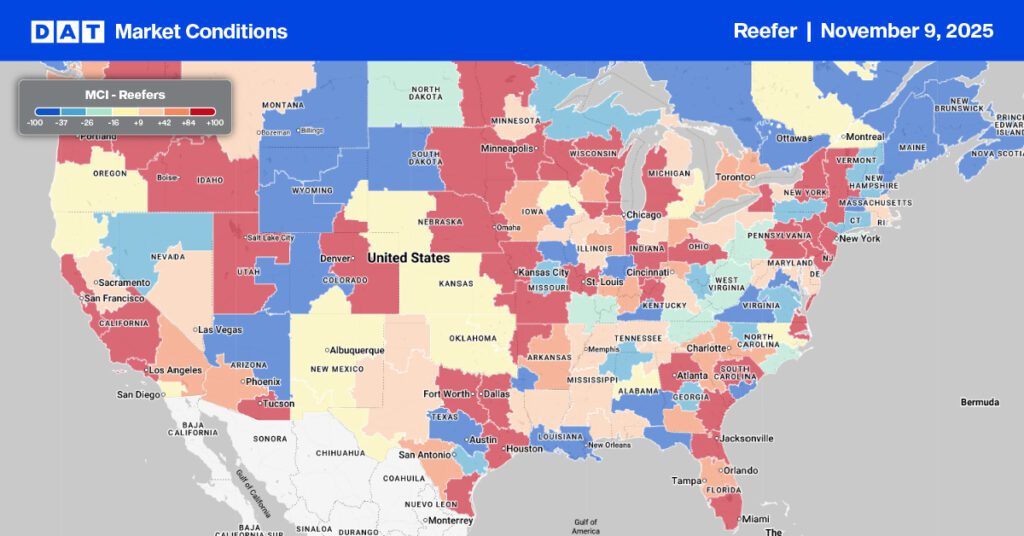
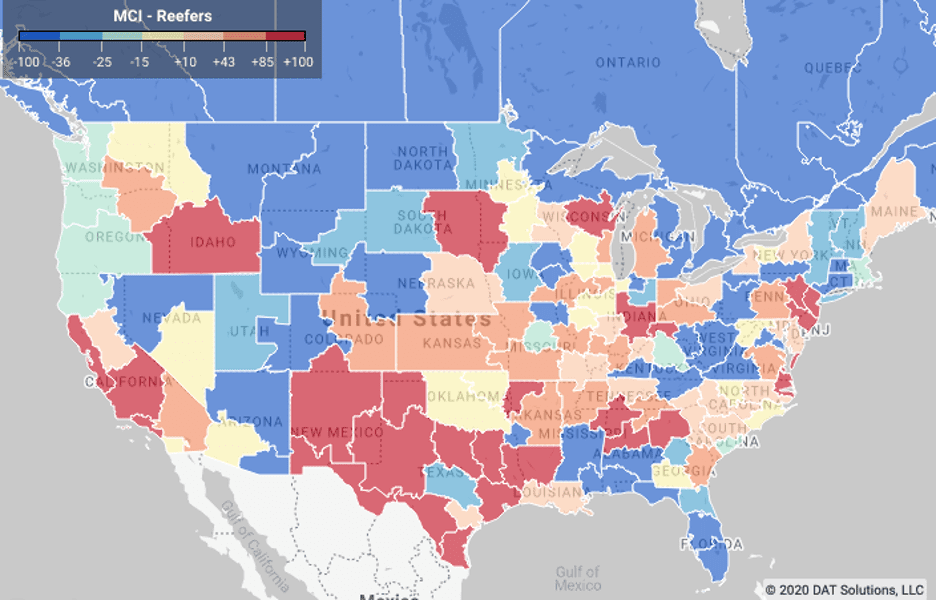
Market Conditions Index (MCI)
The USDA reported that seasonal volumes of produce were down 8% for domestic and 3% for imported truckload shipments last week. That’s the equivalent of 4,868 fewer loads than the prior week. Produce volumes from Mexico continue to decline from their mid-June peak, but are down 6% y/y due to decreased demand in the U.S. food services sector.
The USDA also reported tight capacity for sweet potatoes from Eastern North Carolina, onions from Southern New Mexico, melons and tomatoes from South Carolina, watermelons and onions from Lower Rio Grande Valley Texas, and limes, mangos, tomatoes, broccoli, mixed fruits and vegetables from Mexico crossings through Texas.
Health conscious consumers are driving up sales of citrus during the pandemic, though, especially oranges loaded with vitamin C. As the U.S. citrus season winds down, demand is typically met though imports. Countries like Morocco typically ship high volumes via Philadelphia, but due to higher temperatures and a water shortage in Northern Africa, Moroccan citrus volumes are down 75% this season.
To fill the void, citrus importers have turned to Australia and South Africa, where shiploads have been arriving in Philadelphia since mid-June and are expected to continue weekly arrivals until October. As a result, reefer load volumes out of the Philadelphia market are up 26% w/w and 93% m/m, and although rates held steady at $1.64/mile last week, they are up 14% over the last month. Boston and Lakeland, FL, were the two largest destinations for reefer loads last week, accounting for just under 10% of loads.
Load volumes from the California produce markets of Fresno, Ontario, Stockton and San Francisco increased 9% w/w and are now up 28% over the last three weeks. There are signs capacity is beginning to loosen as spot rates drop for the first time in four weeks – down 3% w/w to $2.34/mile.
> Learn more about the Market Conditions Index
Load to truck ratio (LTR)
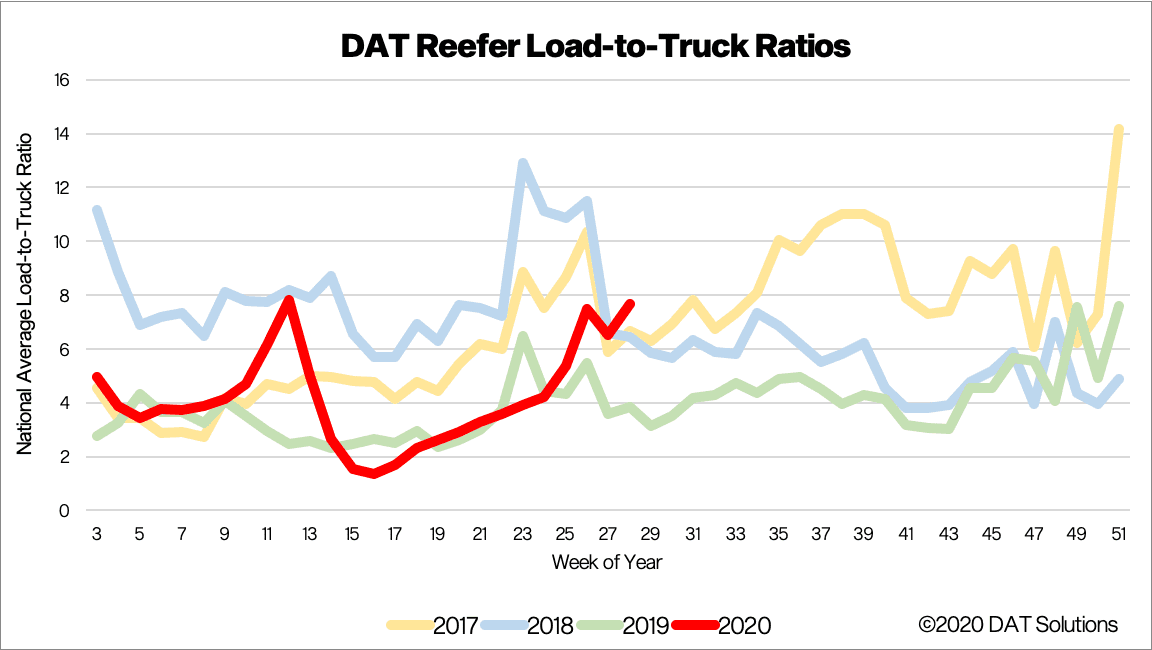
The reefer LTR increased 18% to 7.65 last week, along with a 19% increase in refrigerated volumes – a four-year high for reefer load posts in the first week following July 4. Capacity increased slightly last week with 1% more trucks searching for loads, which is consistent with the seasonal loosening of available capacity in late July.
> Learn more about the DAT One load board network
Spot rates
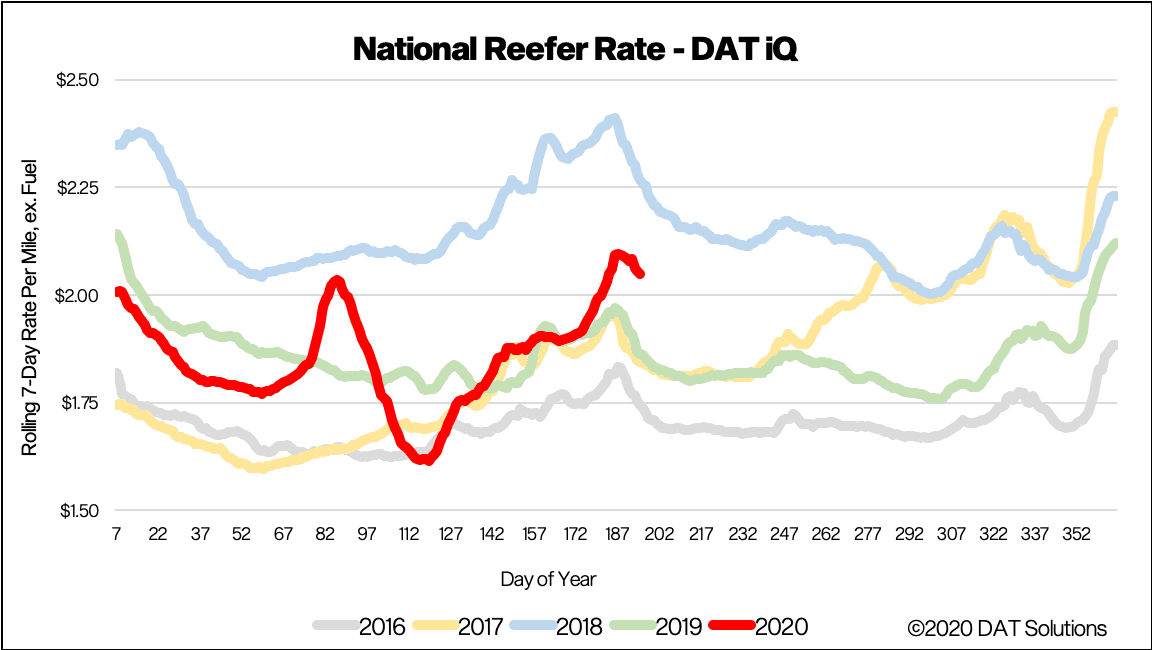
National average reefer rates dropped by 2% w/w to $2.05/mile excl. FSC as reefer capacity began to loosen last week. Reefer rates are still up 9% y/y when rates were 9 cents lower at $1.86/mile.
Our Ratecast model expects reefer rates to have peaked and continue to decline to around $2.00/mile by mid-August.
> Learn more about freight rate tools from DAT iQ
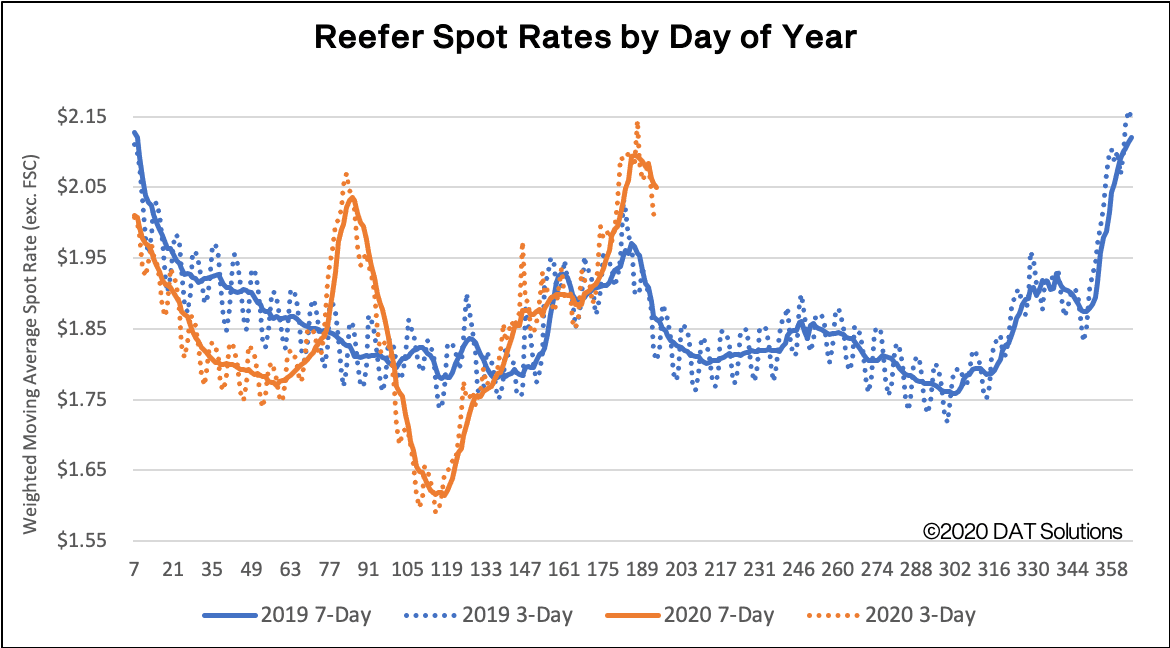
The graphs above shows 3-day and 7-day rolling, weighted averages of spot truckload rates, updated daily, and illustrated by year. The average helps to smooth out day-of-week effects, but it is plotted daily to show how things are changing in the extreme near term.
DAT does not typically publish rates in this format, and as such, they will not match other figures that customers may be familiar with in our blog or other content. We are making these available to the public to help demonstrate the rapidity of changes occurring in the spot market.
> Learn more about custom reporting available from DAT iQ
Spot rate forecasts
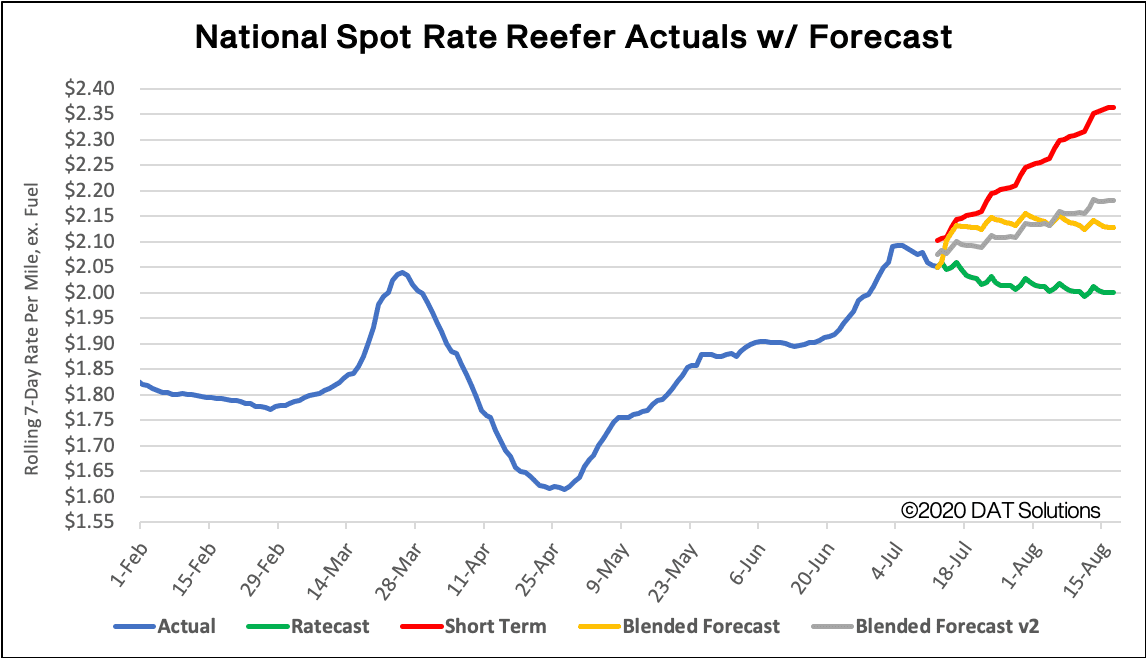
How to interpret the rate forecast
- Ratecast Prediction: DAT’s core forecasting model
- Short Term Scenario: Formerly the pessimistic model that focuses on a more near-term historical dataset.
- Blended Scenario: More heavily weighted towards the longer-term models.
- Blended Scenario v2: More heavily weighted towards the shorter-term models.
> Learn more about rate forecasts from DAT iQ
Flatbed trends
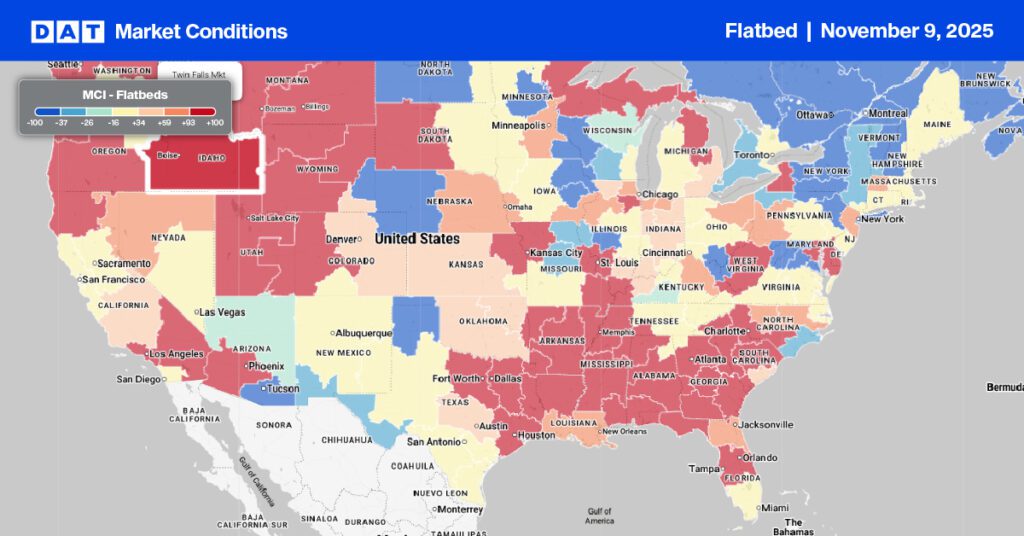
Market Conditions Index (MCI)
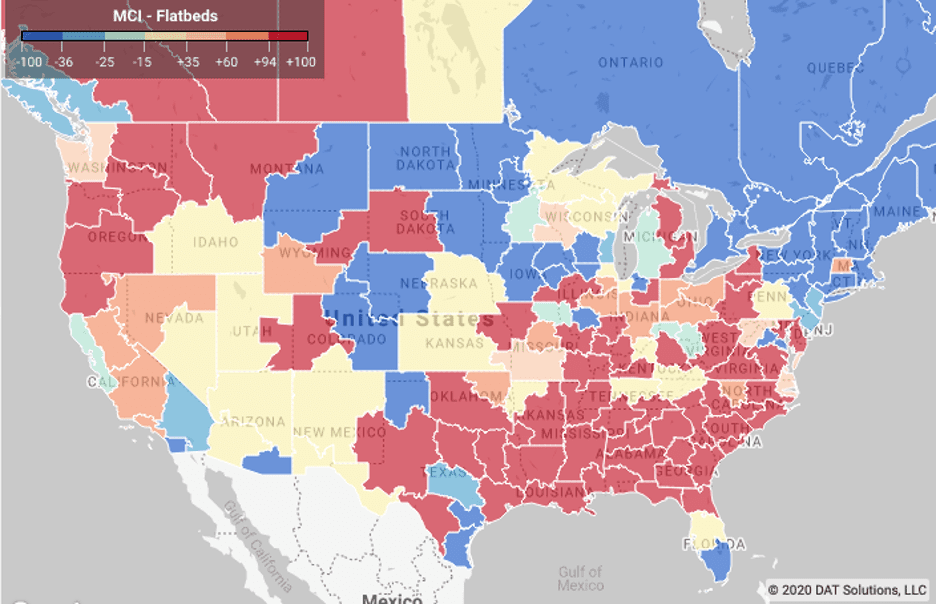
Load volumes in the Southeast remain strong, especially in the top five outbound flatbed states: Alabama, Texas, Arkansas, Georgia and Mississippi. Last week, load posts out of the region topped 211,000, which represents a 17% w/w and 31% m/m increase. Spot rates are also up 15% over the last three weeks.
Business activity also increased in New York State according to the July 2020 Empire State Manufacturing Survey released this week. The general business conditions index rose to 17.2, which is the first positive reading since February, while new orders and shipments also increased. Manufacturing firms also reported that business activity increased in July, which was the first increase since the pandemic began.
> Learn more about the Market Conditions Index
Load-to-truck ratio (LTR)
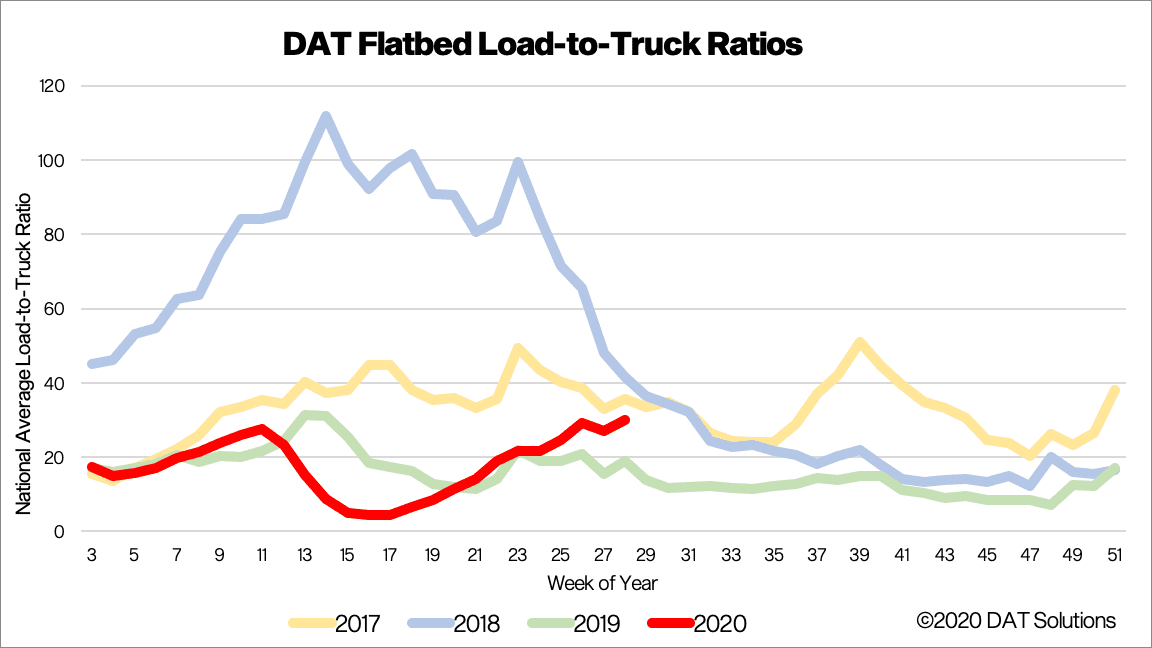
Flatbed load posts increased by 22% w/w, which has LTR heading towards 2017 and 2018 levels when capacity was much tighter. Nine percent more trucks were searching for loads last week, which is more a return to normal after carriers took time off over the July 4 break.
> Learn more about the DAT One load board network
Spot rates
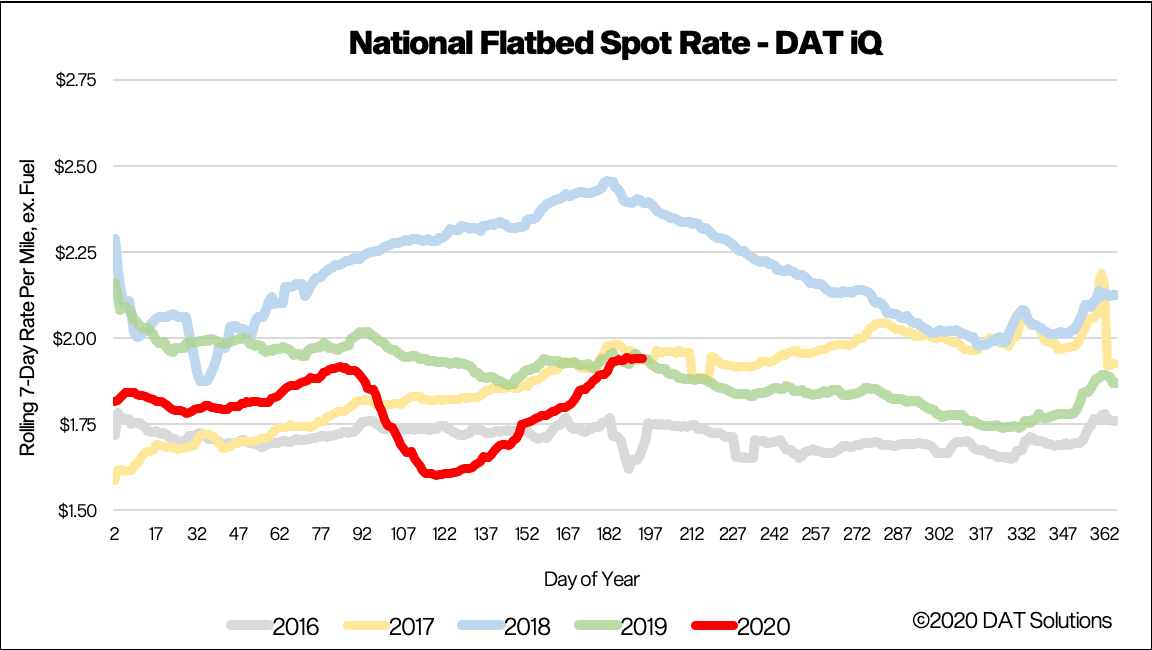
Strong demand for flatbeds pushed the national average spot rate up 4 cents to $1.94/mile, excluding FSC, tracking closely with 2017 and 2019 prices. The Fort Worth and Lubbock markets reported tight capacity, with the largest w/w rate increases of 4% and 2% respectively. The average rate on 58 origin-destination pairings increased from $1.90 to $2.09/mile, with shorter, regional moves to Shreveport, LA, and Little Rock, AR, paying $3.23 and $2.94/mile respectively.
Our Ratecast model expects flatbed rates to have peak on July 6 and drop back to around $1.89/mile by the time we move into the first week of August.
> Learn more about freight rate tools from DAT iQ
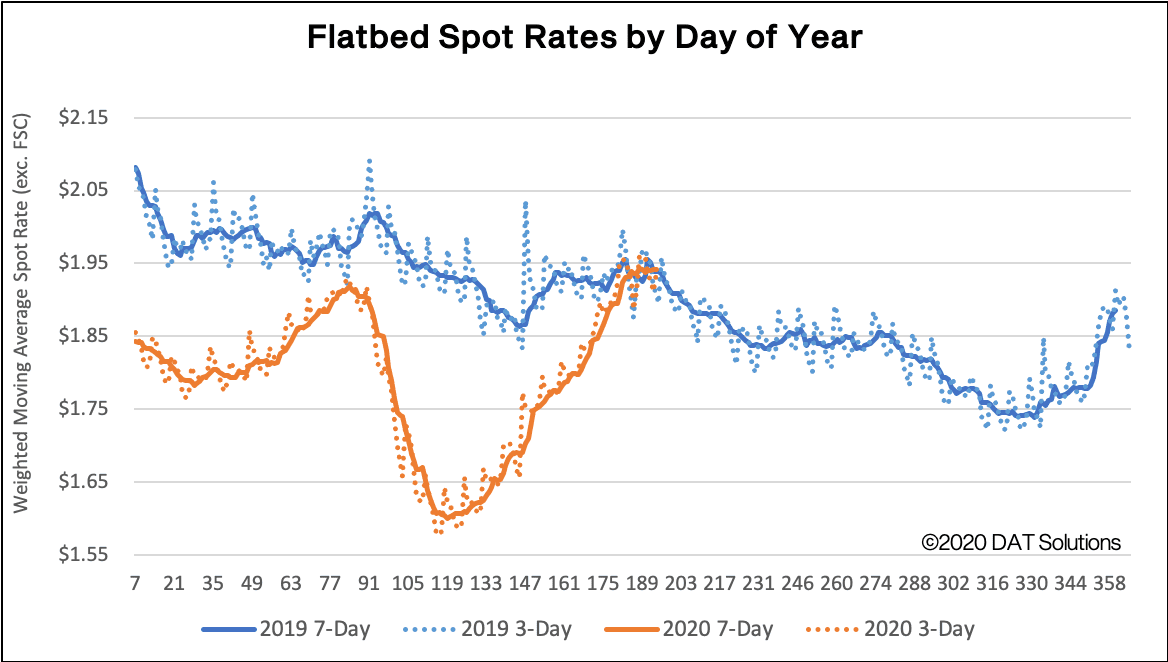
The graphs above shows 3-day and 7-day rolling, weighted averages of spot truckload rates, updated daily, and illustrated by year. The average helps to smooth out day-of-week effects, but it is plotted daily to show how things are changing in the extreme near term.
DAT does not typically publish rates in this format, and as such, they will not match other figures that customers may be familiar with in our blog or other content. We are making these available to the public to help demonstrate the rapidity of changes occurring in the spot market.
> Learn more about custom reporting available from DAT iQ
Spot rate forecasts
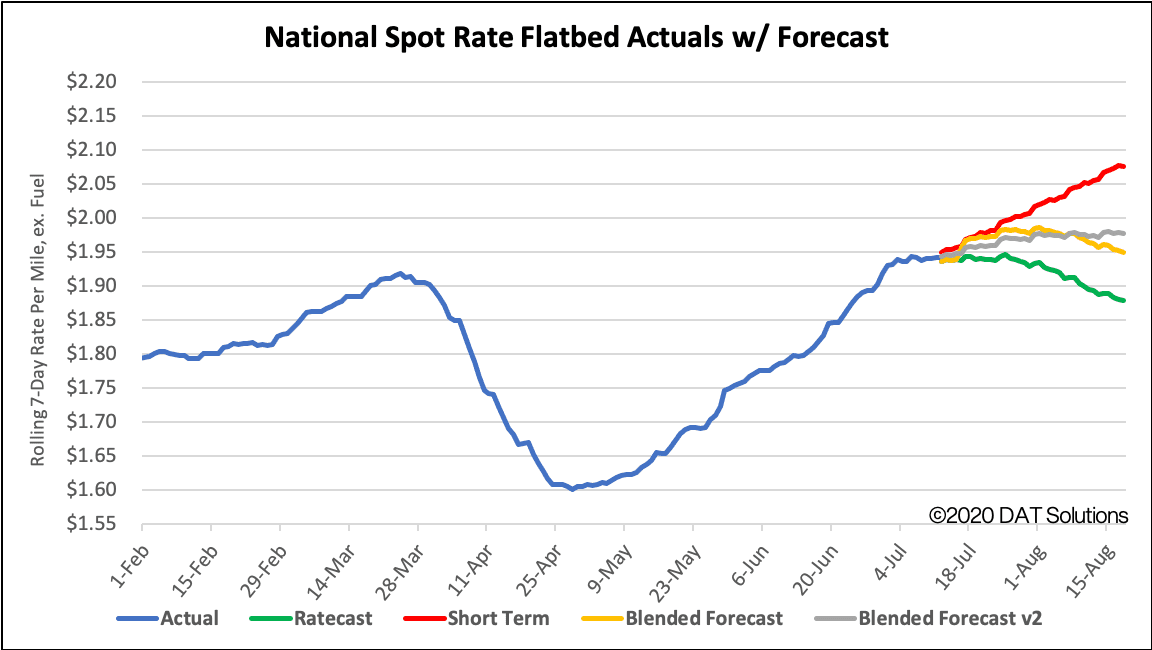
How to interpret the rate forecast
- Ratecast Prediction: DAT’s core forecasting model
- Short Term Scenario: Formerly the pessimistic model that focuses on a more near-term historical dataset.
- Blended Scenario: More heavily weighted towards the longer-term models.
- Blended Scenario v2: More heavily weighted towards the shorter-term models.
> Learn more about rate forecasts from DAT iQ
Need more information…
Our update will be refreshed next week, or sooner if conditions change materially. Any questions on this report or market conditions can be emailed to askIQ@dat.com.
We are also making available, free of charge, the DAT Daily 50 which is a daily report of the top 50 lanes by volume with a week’s worth of history and predictions using the Ratecast model.