Freight rates remain in their typical seasonal slump. We’re now in that lull that occurs after the holidays, but before demand picks up again for spring produce and the beginning of construction season. Last week rates declined for all three equipment types, but most declines were modest.
On the top 100 van lanes last week, rates were pretty equally divided between rising, falling and neutral, indicating that we may have hit bottom and are simply waiting for a rebound.
DAT load boards are the largest and most trusted digital marketplace for truckload freight.
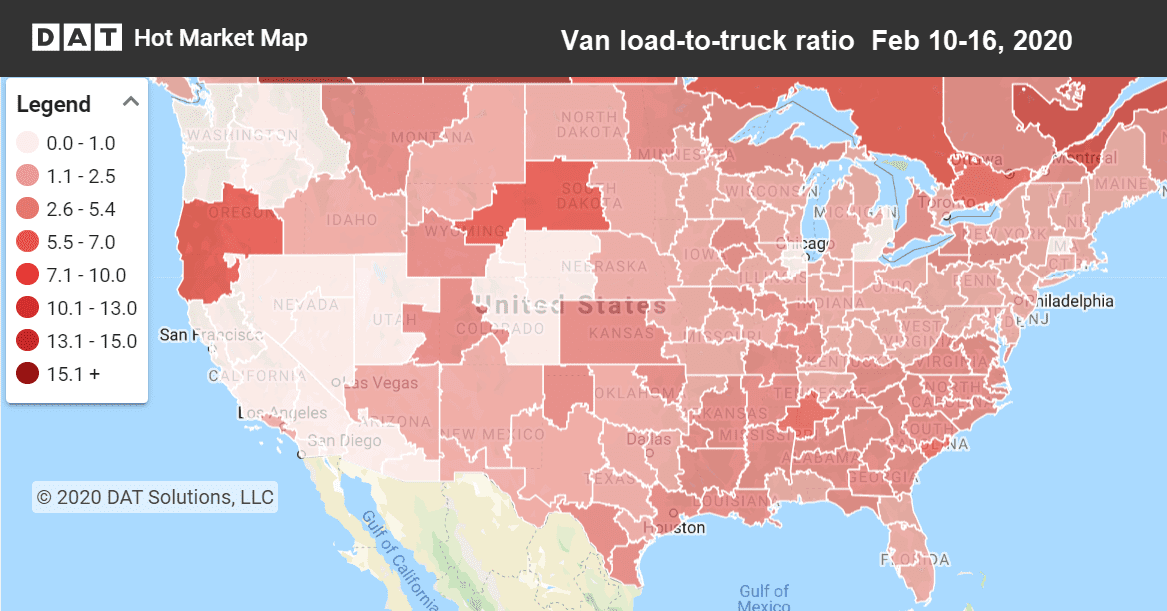
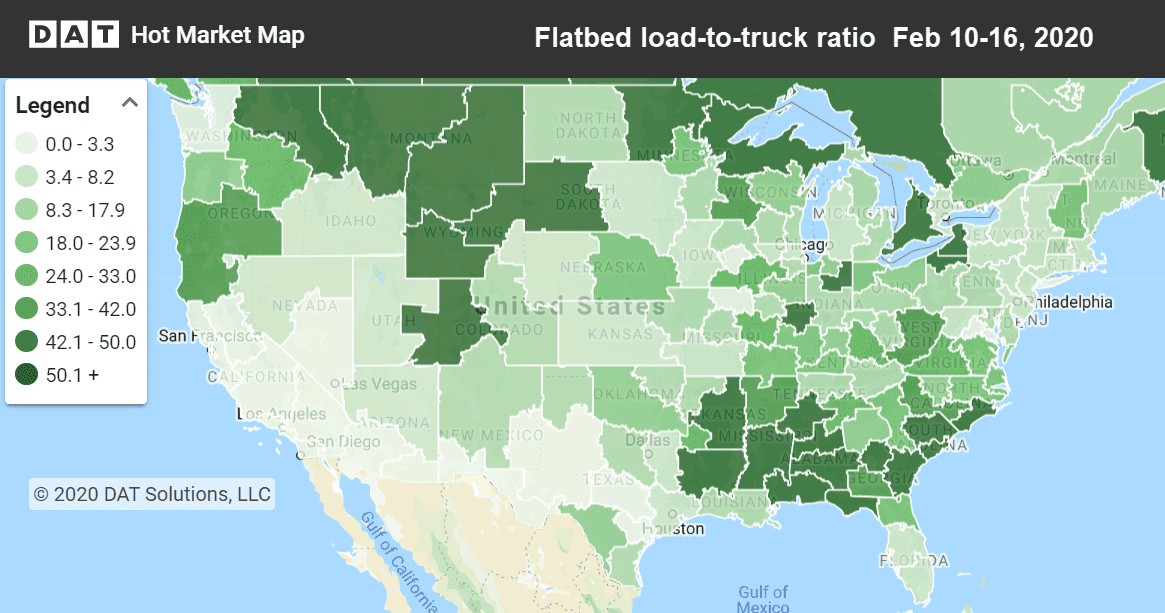
Hot Market Maps show the number of available trucks vs. available loads and are available in the DAT Power load board and DAT RateView.
Dry van trends
Just two weeks ago, van rates were down in 81 of the top 100 van lanes. Last week only 39 lanes were down and 32 stayed the same as the previous week. Another positive sign is that van load-to-truck ratios turned upward last week, showing that demand for trucks is on the rise.
On the other hand, many of the lanes with the largest rate increases were those where prices were well below the national average, such as:
- Denver to Oklahoma City jumped 16¢ to $1.33 per mile
- Dallas to Los Angeles gained 9¢ to $1.28 per mile
- Lakeland, FL to Atlanta added 5¢ to a mere $1.00 per mile
Freight markets were rates moved lower included:
- Denver to Albuquerque, NM slipped 12¢ to $1.86 per mile
- Los Angeles to Chicago dropped 11¢ to $1.23 per mile (this lane competes heavily with rail)
- Buffalo to Columbus, OH was down 9¢ to $1.75 per mile

Rates often hit their lowest point of the year in February, and this year is no different.

Reefer trends
Reefer freight is still waiting for spring produce to arrive. Last week both load-to-truck ratios and rates declined, and in the top 72 reefer lanes, 46 moved lower. It’s still a little early for Florida’s big push, but we’re seeing rates creep up on some of the major lanes out of Florida:
- Miami to Atlanta jumped 27¢ to $1.76 per mile
- Miami to Elizabeth, NJ gained 12¢ to $1.71 per mile
- Lakeland, FL to Charlotte added 10¢ to $1.58 per mile
Imports and exports are also providing a little lift for reefer freight. As you can see in the Hot Market Map above, we’re seeing elevated load-to-truck ratios in the port cities of Savannah, GA, Charleston, SC, and Wilmington, NC.
Flatbed trends
February has held up better for flatbed freight. Load-to-truck ratios increased 16% week-over-week, and rates are just 3¢ lower in February than they were in January and December. As seen in the Hot Market Map above, demand is currently greatest in the Southeast and northern Rocky Mountain freight markets. Here are some of the flatbed lanes were rates increased the most:
- Jacksonville, FL to New Orleans bumped up 39¢ to $2.02 per mile
- Baltimore to Springfield, MA rose 33¢ to $3.65 per mile
- Memphis to St. Louis, MO added 11¢ to $2.86 per mile


